The Photographer’s Guide to Instagram Analytics
For years, photographers have been using Instagram as a hub to showcase their creativity. As the popularity of the platform grew, savvy photographers quickly learned that they could use Instagram to grow their businesses as well. Having an engaged following on the platform has helped photographers grow a tribe around their business or product and has earned them opportunities to partner with brands leveraging social media influencers.
While you certainly don’t need to seek influencer status to see results from Instagram, there are a few things that influencers know that every photographer should take note of. Influencers study their following and know what works to engage the tribe that they’ve built. Before Instagram rolled out business accounts, users either had to do guesswork and follow their gut to test what worked for their audiences or invest in third-party tools to see the data on their accounts.
Instagram began beta testing new Business Profiles in 2016. Today, everyone has access to them, and Instagram’s native analytics comes free with Business Profiles. Despite being owned by Facebook, Instagram’s native analytics are still nowhere as powerful as Facebook’s native Insights. So, in this article, we will be going over everything that you can learn about your audience and growing your Instagram account using native analytics. We’ll also touch on a few third-party tools that you might want to check out if you need more data than what you can access in Instagram natively.
Why You Should Care About Your Instagram Analytics
Too many businesses approach social media without a strategy in place. Investing time and resources into social media without a plan, and without measuring results, is like spending your time and money in a casino. Sometimes you win big, and other times you walk away with nothing.
At the end of the day, you need to understand the data of what works for your business. This empowers you to make informed decisions that will create the kind of growth you need to achieve your business goals. If you’re just beginning to approach Instagram for your business, you may want to check out our article on creating a social media strategy for your photography business. Once you have your goals in place, your strategy is the roadmap to get you there, and your analytics are the signposts along the way!
Let’s think of an example: your business is selling fine art landscape prints and you use Instagram as a gallery to showcase all of your work. As a part of your strategy, you might want to begin testing images that show your prints framed on the walls of beautifully designed interiors to appeal more to prospective buyers. You’ve also heard that Instagram Stories are a great way to showcase your business while still keeping to a specific aesthetic in your profile gallery.
By using the data from your Instagram analytics on how your audience is engaging by liking, commenting and clicking, you’ll be able to see what content is resonating and what isn’t. You’ll be able to see if images of your printed products perform better than showcasing the image itself, or if different post types such as carousels and videos get better reach and engagement. From here you’ll be able to do comparisons and make a decision about your content mix, and whether you need to get your audience imagining what your print would look like on their wall, or if you need to be showing more detail shots.
How to Access Your Instagram Analytics
Right now, Instagram analytics are only available to Business Profiles. If you’ve been running a personal account so far, but you’re serious about using Instagram to grow your photography business, then I recommend making the switch. We walk you through the steps in our Instagram Marketing Guide.
If you’re hesitant to pull the trigger on a Business Profile, don’t worry because you can always switch back. The Instagram scheduling app, Later, also has a nice flowchart for anyone who isn’t sure if a Business Profile is right for them:
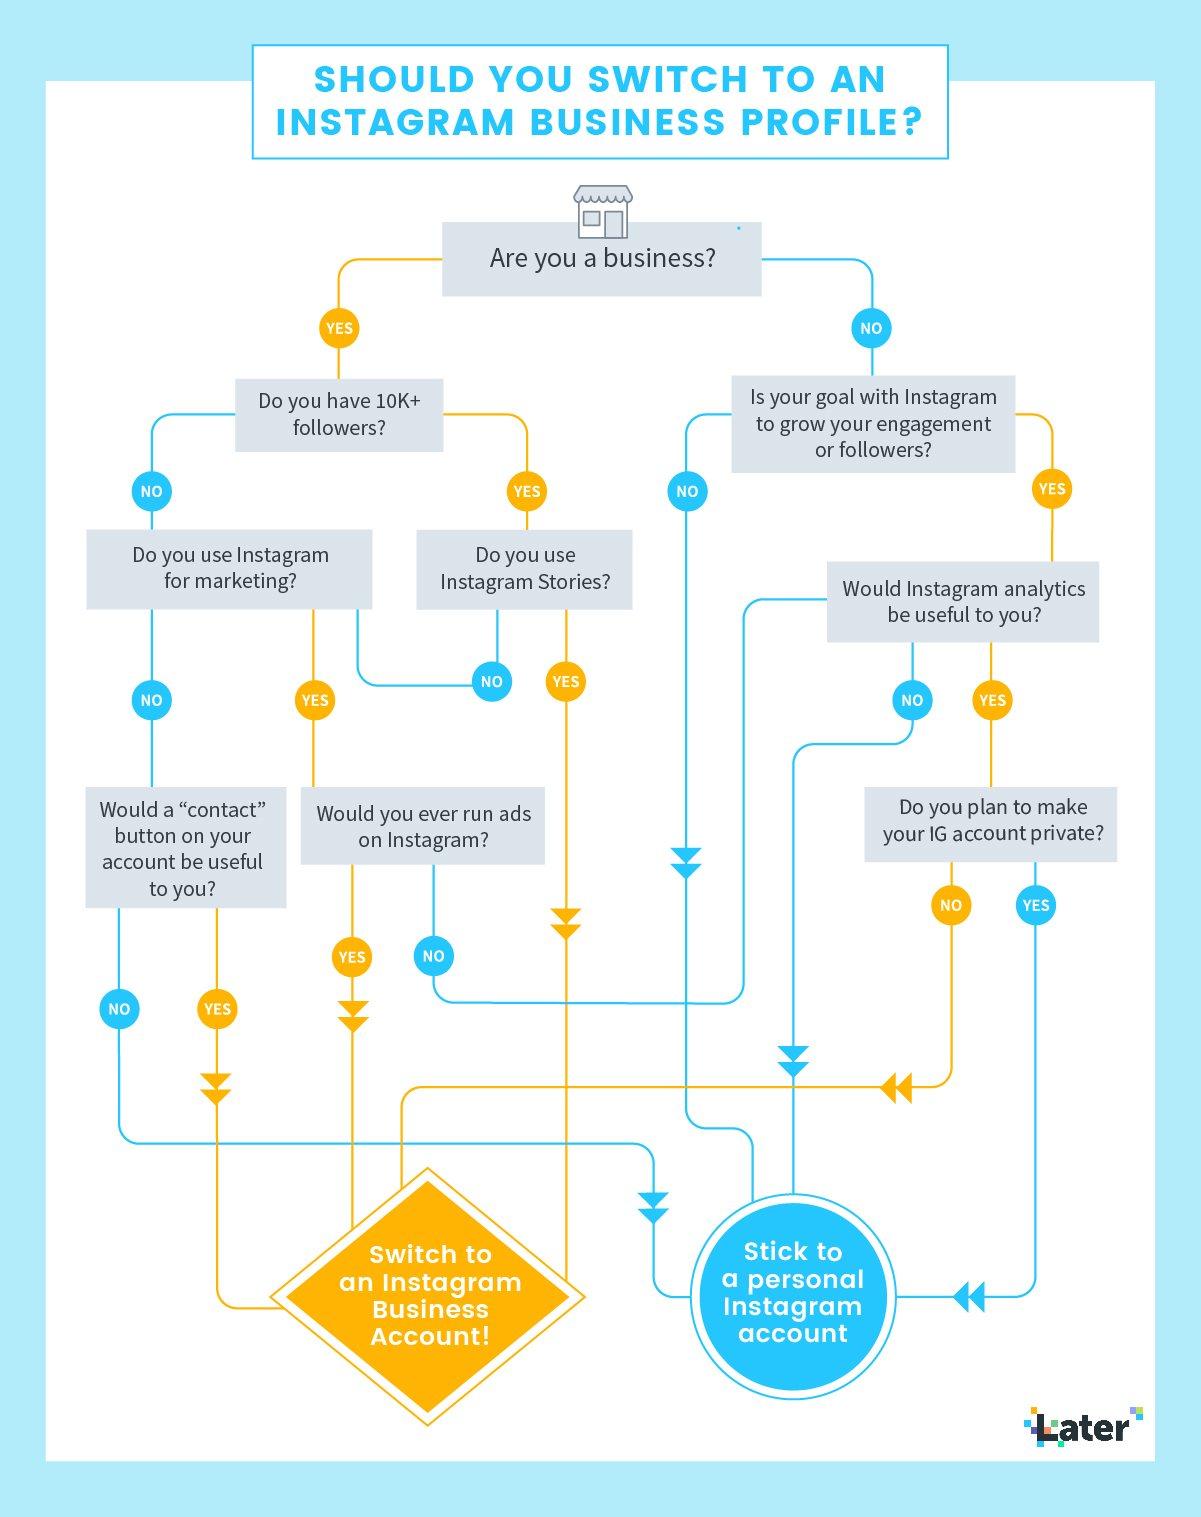
Image via Later
At the end of the day, if you’re reading this article, chances are you’re a good fit for a Business Profile. If you haven’t transitioned over yet, it only takes a few minutes. It may take some time for Instagram to populate the data from your account, however, so give it a little time before you try to dive into the data.
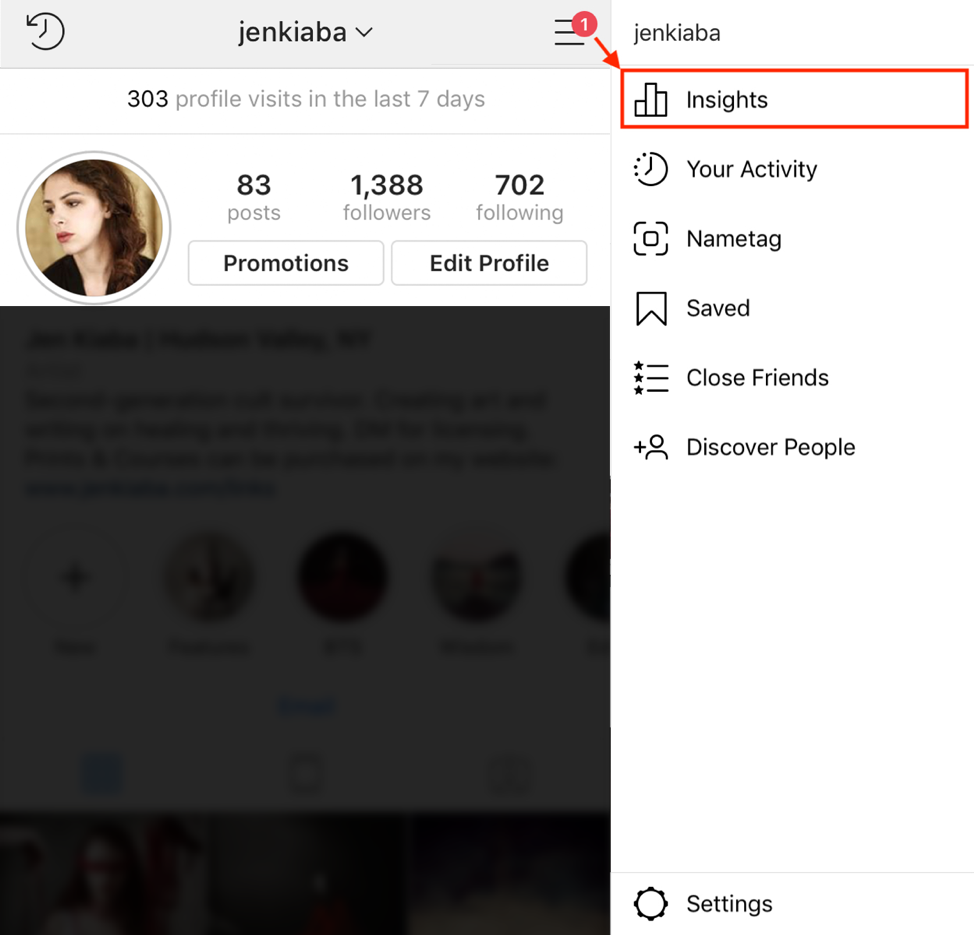
If you’re already set up with a Business Profile, then you can easily access your analytics in the Instagram app by navigating from your settings to your Insights tab.
Currently, Instagram’s native analytics only give you data on the past seven days for many of the metrics that it tracks. It also takes seven days to report on other metrics, such as followers. So this means that unless you’re using a third-party app to track your Instagram performance, you’ll need to look at your Insights data on a weekly basis to get a healthy idea of how your content is performing.
Let’s take a look at what you can discover with Instagram’s Insights:
Instagram Activity Insights
The first section you’ll see when accessing your Instagram Insights is the Activity tab. Here is where you will see the Interactions on your profile for the week, and how your profile was discovered. Instagram defines Interactions on your profile as Profile Visits and Website Clicks.
Contact requests will be tracked as well, depending on the options you’ve chosen in your profile (email, phone calls or directions).
So in the past week I can see that my content drove an increased amount of traffic to my profile versus the prior week. But there were no major spikes or dips in terms of website clicks or emails week over week. Wednesday was a high point for interactions on my profile, with Tuesday and Sunday being relatively quiet days:
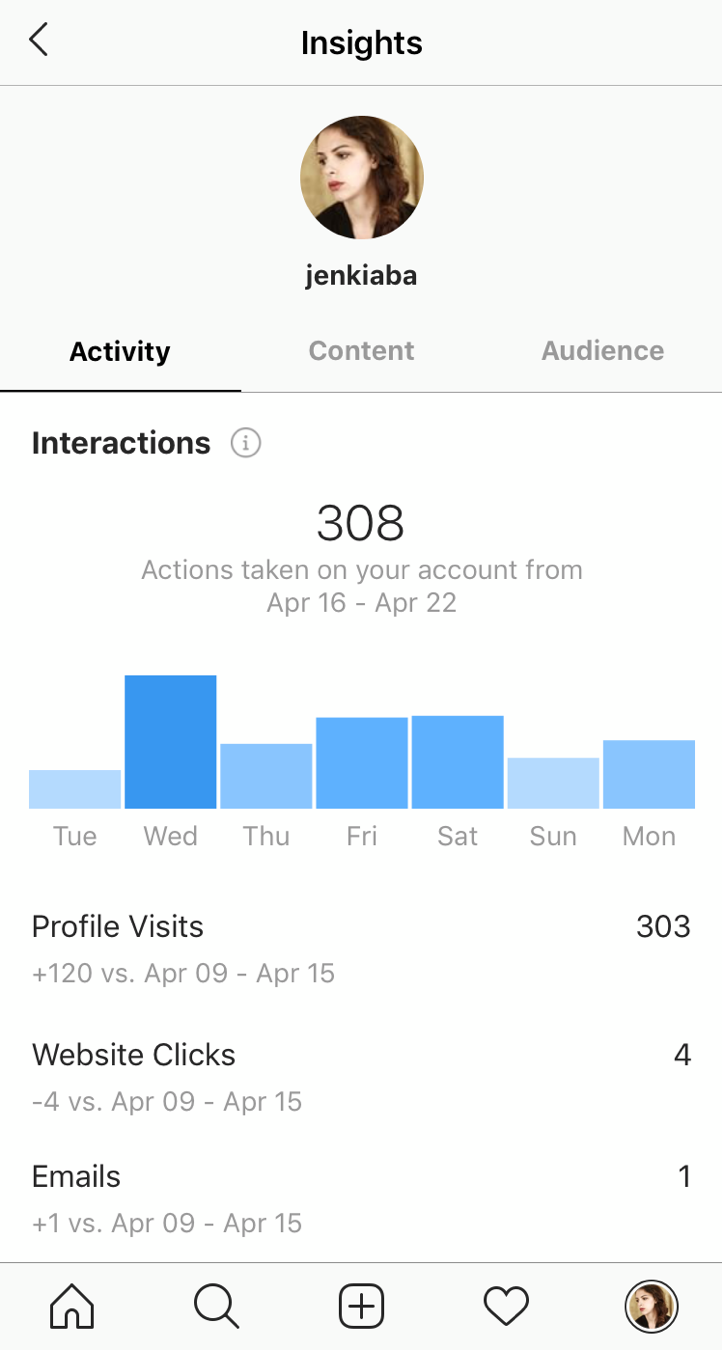
Because Instagram doesn’t allow links in posts, and relegates them to your profile, you may want to track the ratio of profile visits to website clicks. As we discussed in our Instagram Marketing article, your bio is a great place to advertise a lead magnet. Currently, I don’t have a specific lead magnet that I am promoting, so a little more than one percent of my profile visitors are clicking through to my website. For reference, AdStage estimated that in 2018 the average click-through rate on Instagram Ads was only 0.52 percent.
While this isn’t a perfect comparison, it does give us an interesting benchmark. If I was actively trying to promote a product launch or new offering in my organic posts, I would be curious to see if my click-through rate were to go up. Depending on what your goals are for your photography business and posts, you can do similar calculations for Emails, Phone Calls and Get Directions clicks.

When you scroll down in your Activity tab, you’ll also see the Discovery section. Here we can see our account Reach on a daily basis for the past seven days, as well as how many Impressions we received. Reach is the number of unique accounts that have seen any of your posts, while impressions is the total number of times that your posts have been seen. Your impressions will probably always be higher than your reach simply because users often see your posts more than once.
A quick glance at my Insights tells me that Wednesday was a stellar day for my reach. When you’re looking into your own analytics and you see an anomaly like this, I would make a note to dig into what was posted on that day to create such a spike in reach. I’ll show you how to do just that a little later in this article.
Instagram Content Insights
The second tab available in your Instagram Insights is for the Content you’ve posted in the past week. Here you’ll see the performance of your Feed Posts, Stories and Promotions:

This is where you can see how many posts you’ve made in the past seven days, compared to the prior week. It’s a little bit confusing how Instagram lumps feed posts and stories into the overall number at the top, so let’s clear that up. For example, my Insights say that I have posted 16 times in the past seven days, which is a drop of 11 posts as compared to the prior week.
At first glance, one might think this means that I posted to my feed 27 times last week! But because my content calendar only has me posting three times a week to my feed, I know that the difference of 11 posts is made up in stories. Although Instagram Stories are a fun way to interact with your audience, I can see by my Activity stats that the difference in story posts week over week didn’t hurt my reach, impressions or overall profile visits.
If you were to see similar data in your Instagram Insights, you might ask yourself if there’s room to improve the quality of your stories. The reason I ask myself that question is because 11 less stories week over week is a big drop in content. Yet overall in my data, the reach and impressions increased. This tells me that my stories haven’t been a big driver of reach and impressions overall. So I’m thinking that I could get more strategic about my stories and think about them as ways to invite more engagement in my account. So far, they have been very spur-of-the-moment content, but I am now looking at incorporating them more into my content calendar, and tying them in more with what I am sharing in my feed.
Further down on the Content tab, you can see the three most recent feed posts and stories you’ve shared and the number of impressions they have gotten. If you’ve shared a post or story recently, it can give you a skewed sense of the data. For example, my most recent feed post was shared only a few hours before writing this, which is why it only has 302 impressions – a third of the other two recent feed posts. So keep this in mind when examining your numbers.
Now, if you were to see similar numbers and you know that you didn’t just post something, then it would be important to ask yourself some questions about what changed from post to post. For example, did you try posting a completely different kind of image? Were you testing out new hashtags? Or did you try posting at a new time? Any number of these factors could cause a big change in whether enough people engaged with your post to signal to the algorithm that it was content worth distributing further.
If you’ve been boosting Instagram posts, you’ll also find information about your promotions here.
Historical Content Insights on Feed Posts
One area that Instagram does give you historical insights beyond the past week is your post performance. By clicking on See All, either for your feed posts or stories, you can analyze what content has been the most effective. The maximum lookback window is two years, and you can analyze by post type (Photo, Video, Carousel or Shopping Posts which are only accessible through certain partners like Shopify) and by engagement type (Impressions, Comments, Likes, etc.).
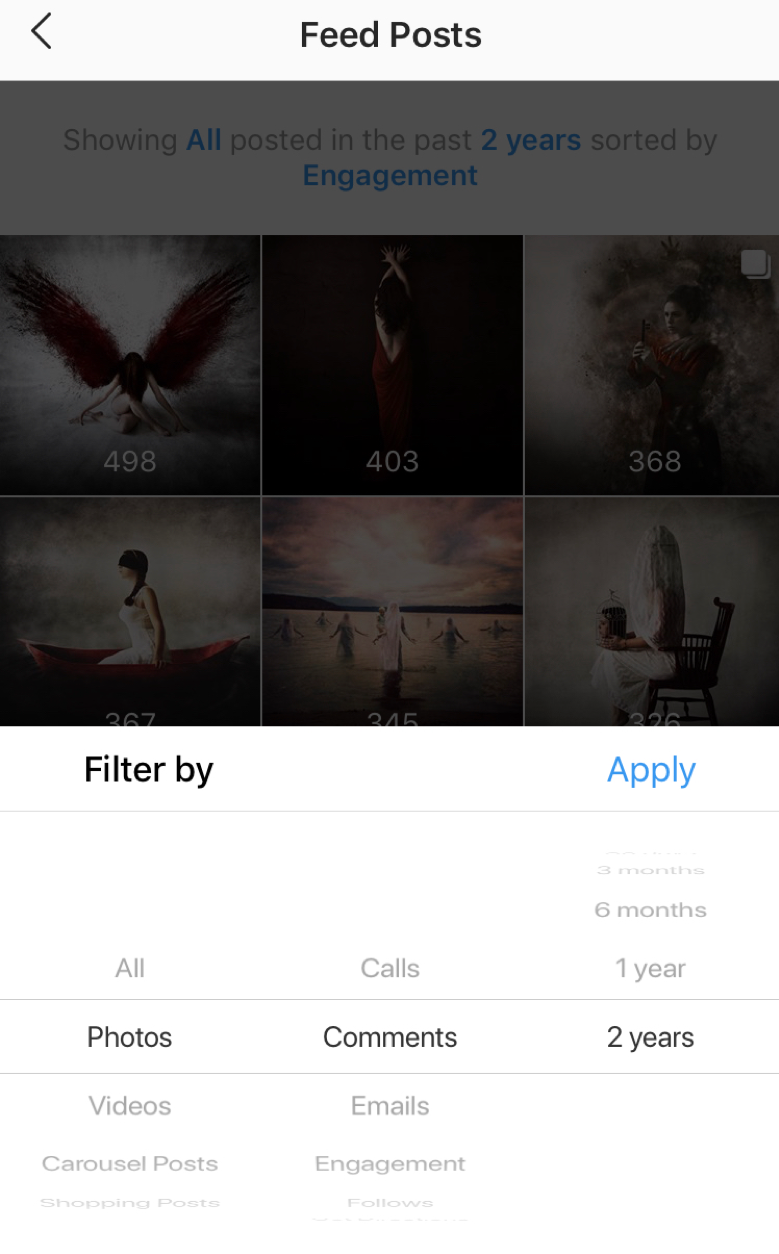
While the two-year lookback option is nice, when you’re analyzing your content, try looking at different time periods. You might find more actionable insights by looking at a 30-day window because your style or strategy could have shifted. My most popular images over the past two years aren’t a reflection of the kind of content I am currently creating. And while my strategy is to mix old images in with newer ones, if I let my two-year lookback dictate my strategy I wouldn’t be comfortable sharing my new work. A 30-day lookback window gives me a better idea of how newer content in my mix is performing.
Individual Post Performance
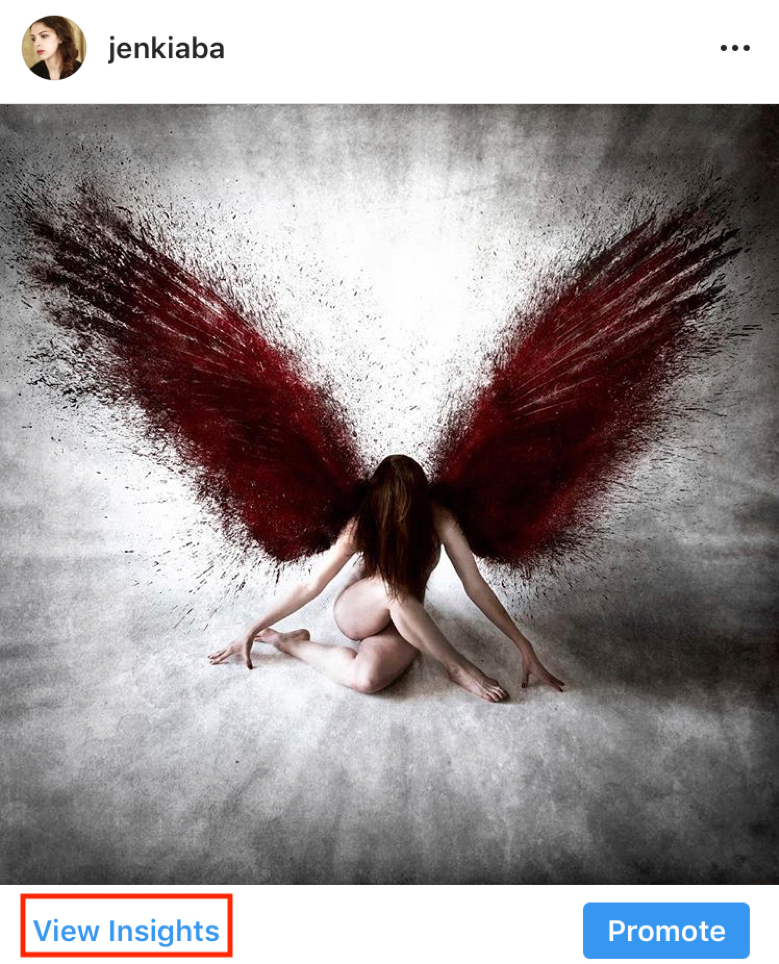
To see how a specific feed post performed, you can click on it either from Insights or from your profile. You’ll see a small link in the left-hand corner to View Insights:
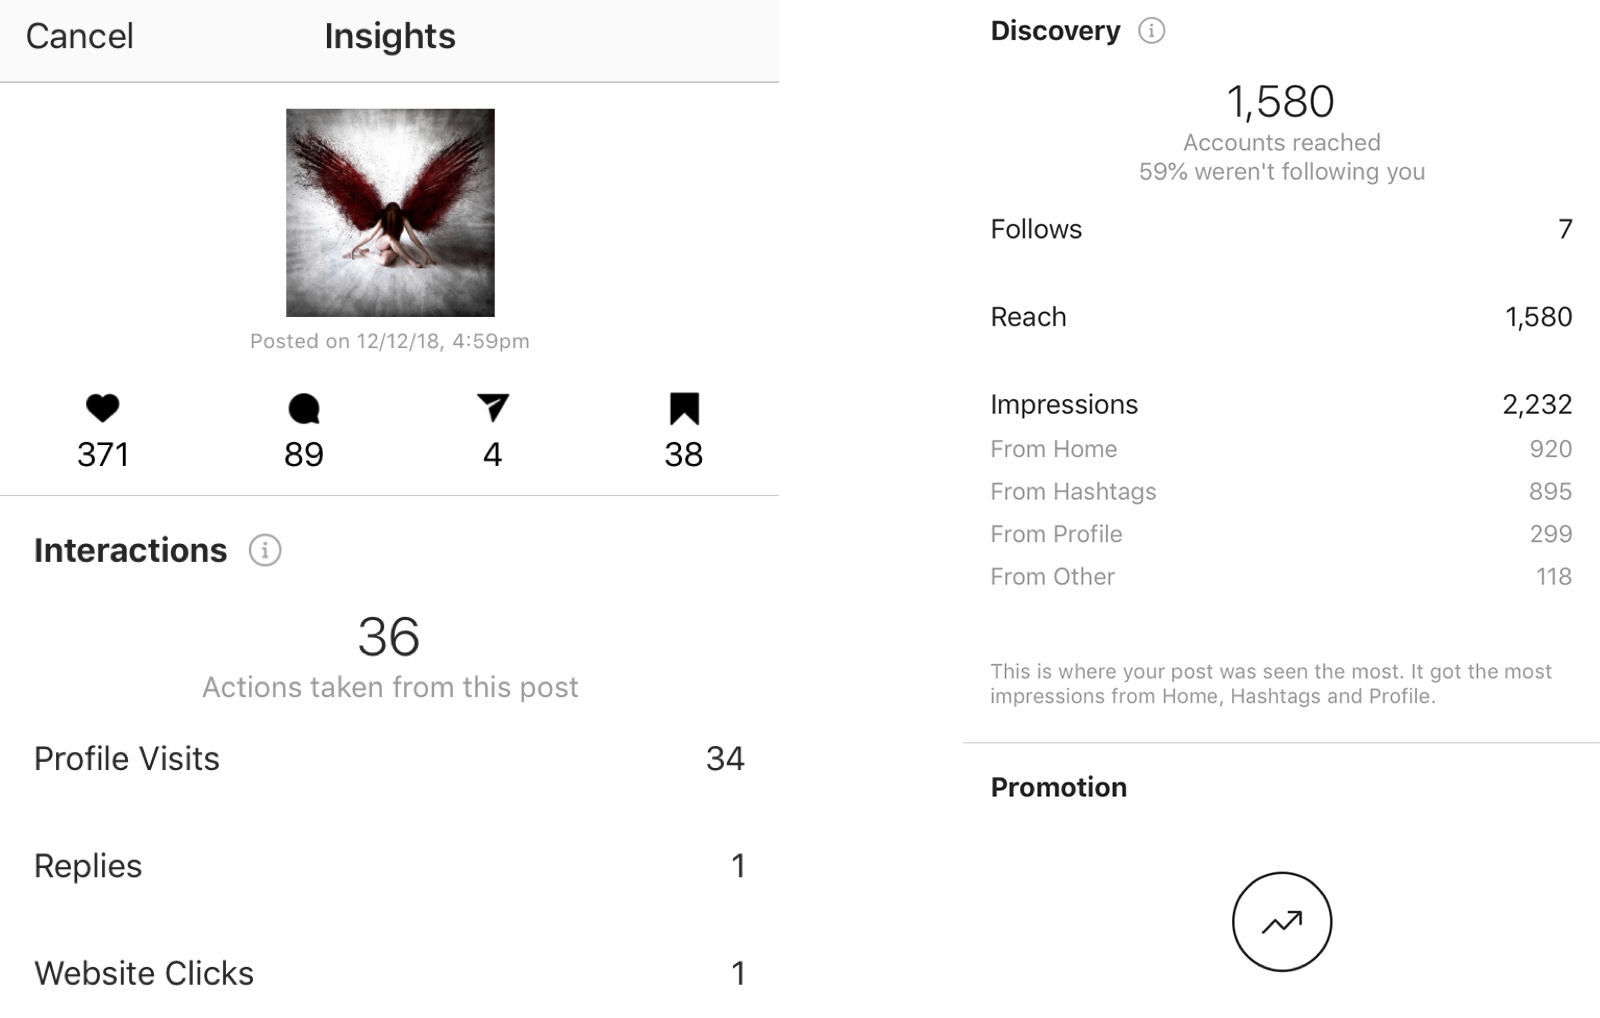
Here you will be able to see the same metrics, but only for a specific post, instead of for your overall account. At the top, we can see how many likes, comments, shares and saves the specific post got. Further down, we can also see how many Actions – and which Actions – were taken on our profile as a result of the post.
While this information is nice, the data that I find to be the most valuable is under the Discovery section. Here we can see how many follows we got and what our reach was. What I am most interested in is the impressions. I know from some of my recent posts that, on average, my feed posts are getting about 900 impressions, and most of those from the home feed. What was different about this particular image was that it got a lot of attention via the hashtags I was using. We can see that there were almost 900 impressions just from the hashtags, bringing my overall impressions closer to 1600.
So, with the right hashtag strategy, you can greatly increase the number of accounts you reach and engagement on your images. While Instagram Insights won’t tell you which hashtags are the ones that spark the most engagement or impressions, you can usually guess. To do this, look at the hashtags you’ve used for a post, and if you find that you’re in the top section of a particular hashtag feed, you can guess that it’s what worked for you.
Hashtag performance will vary from post to post, and day to day. So when you dig into the performance of your individual feed posts, be sure to pay close attention to where your impressions are coming from. If you see that you’re getting a lot of impressions from accounts that don’t follow you, then it’s worth taking some extra time to see if any hashtags you’ve used have made it to the top of their feed.
Historical Content Insights on Story Posts
With stories, the historical insights that you can see are a little different. Instagram only gives us a 14-day window and we can see performance based on metrics like Follows, Impressions, Link Clicks, Forward, Exited, etc.
Because some metrics that stories are measured by are different from feed posts, let’s look at how Instagram those unique metrics:
- Taps Forward – This is the number of times someone taps to skip to the next piece of your story. Instagram’s algorithm can look at this as a sign of people not being engaged with a story. So if you use stories to show people your editing process and use text like “Tap to Edit,” just be aware that Instagram might not see this as a positive engagement. Try adding text to these stories so that people will hold their thumb down and pause the story, thereby showing the algorithm that people were engaged.
- Taps Back – This is the number of times someone taps to go backwards to a previous piece of your story. A tap back lets Instagram know that people want to re-review your story and this sends a message to the algorithm that they want to spend a little more time on it.
- Replies – This is the number of times people send you messages through the Send Message option on your story. When people send you messages from your stories, it shows a very positive level of engagement to Instagram, and your stories will show up more often at the top of people’s home screens as a result. So experiment with asking questions or soliciting feedback to get more replies!
- Exits – This is the number of times someone leaves the stories viewer to return to their main Instagram feed. If you have a string of stories that have an overarching narrative, ideally you want a lower number of exits. But if you’re posting stories sporadically, this metric might be less meaningful to you.
- Next Story – The number of taps to the next account’s story. While slightly different than exits, my recommendation is to look at this metric in a similar context. If you post one-off stories, then this metric will have less value to you. But if you’re posting a string of videos in your stories, or text/image posts that tie together and you have a high Next Story rate, this could be a sign of poor engagement.

Individual Story Performance
As with individual feed posts, you can see the performance of individual stories as well. However, you can only see the detailed performance data of a story during the 24-hour window that it’s live. To see the data of a live story, click on the bottom left-hand corner.
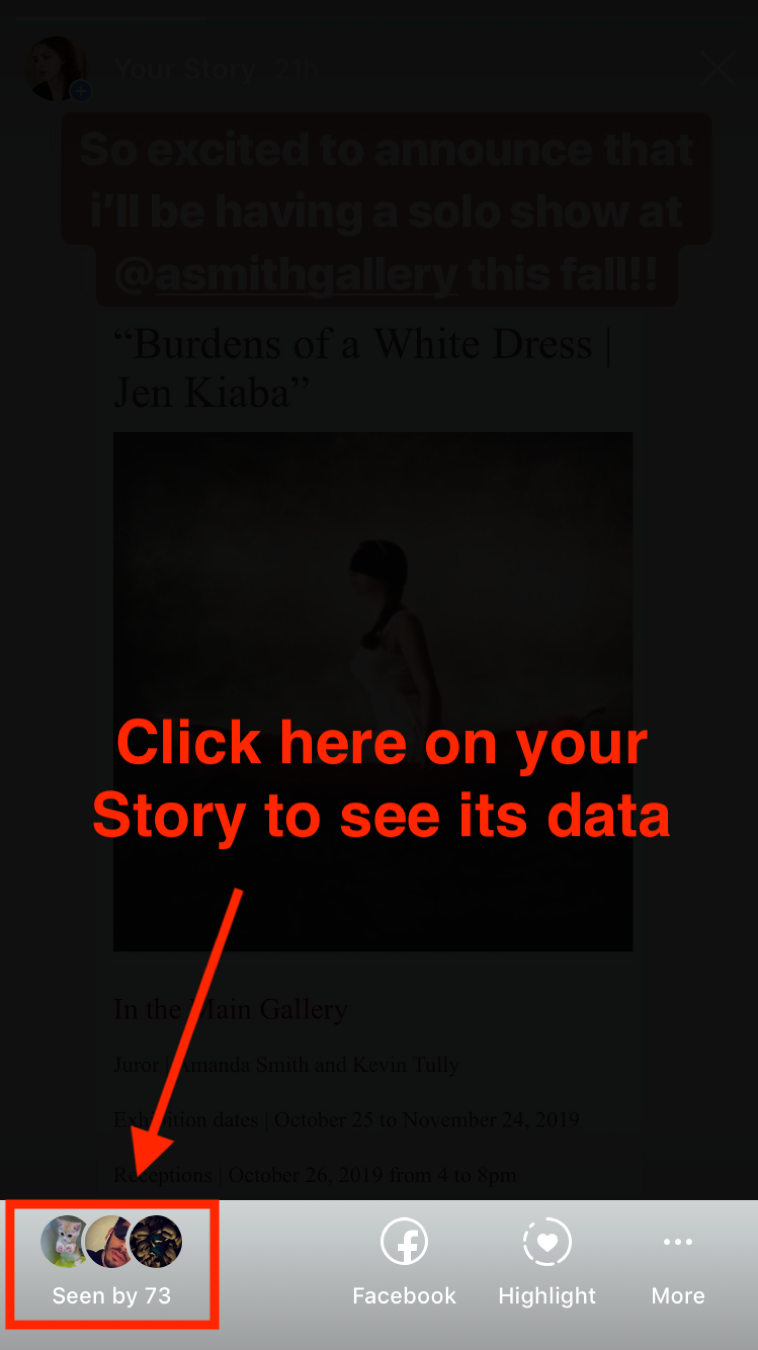
By default, this shows you who has seen your story. But in this new window, if you toggle to the graph icon, you will be able to see the data that has been collected on your story:
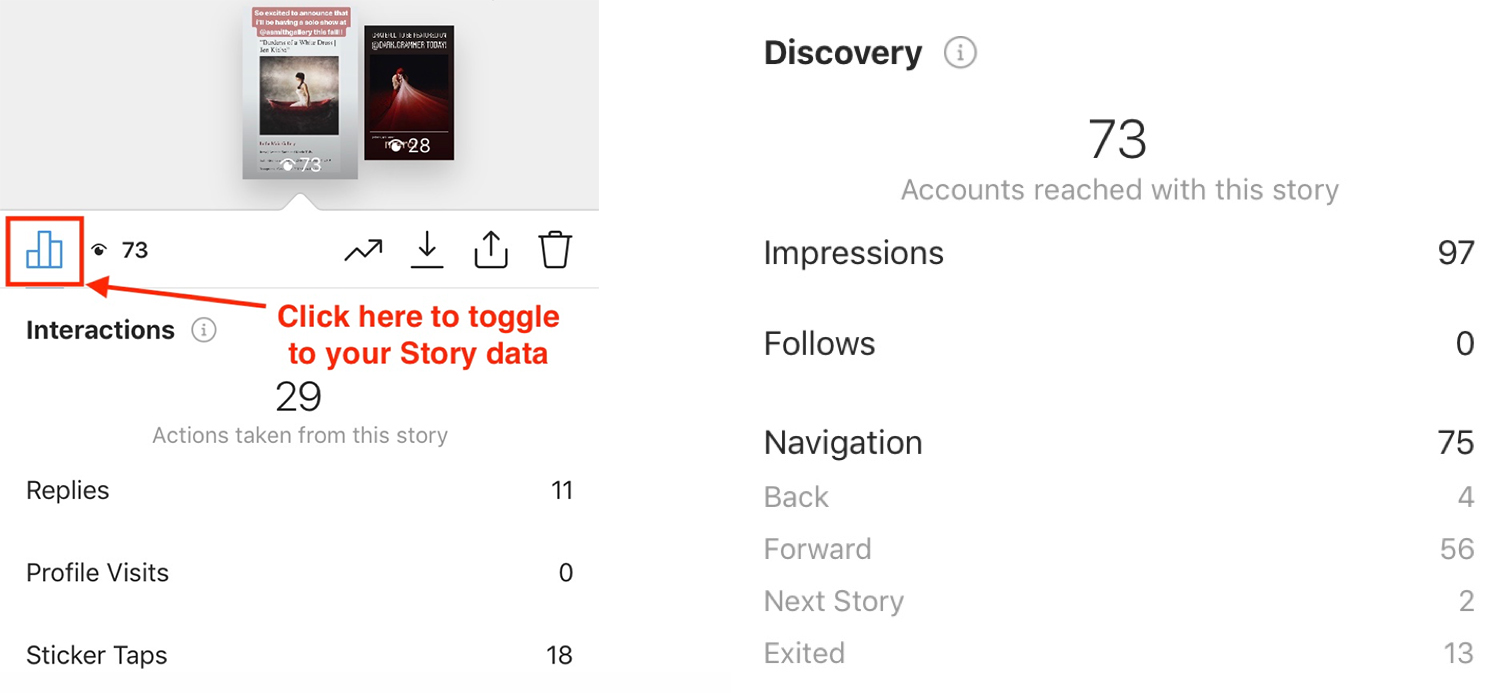
Keeping tabs on your daily story performance can help you to learn what kinds of posts are the most engaging to your audience!
Instagram Audience Insights
When you navigate to the Audience tab in your Insights, you will be able to see how many followers you have, your follower growth, as well as basic information about who your followers are.
The first metric that you’ll get is your follower count and its growth over the prior week. Unfortunately, Instagram does not give you a longer lookback window on this, which would be really valuable to photographers looking to grow their audience. There are some third-party apps that will track this information for you, but so far Instagram doesn’t offer the nice historical data that Facebook does.
So for now, if follower growth is important to you, take a look at this metric on a weekly basis. The nature of Instagram is that people follow and unfollow pretty regularly, so don’t check your follower count on a daily basis. You’ll just make yourself crazy that way. But check your Insights, and if you’re seeing that week over week your follower count is growing, then you’re doing something right. If you see a spike in followers over the prior week, take note of that and look at your feed post and story insights. This will help you understand if a specific post helped grow your following for that week.
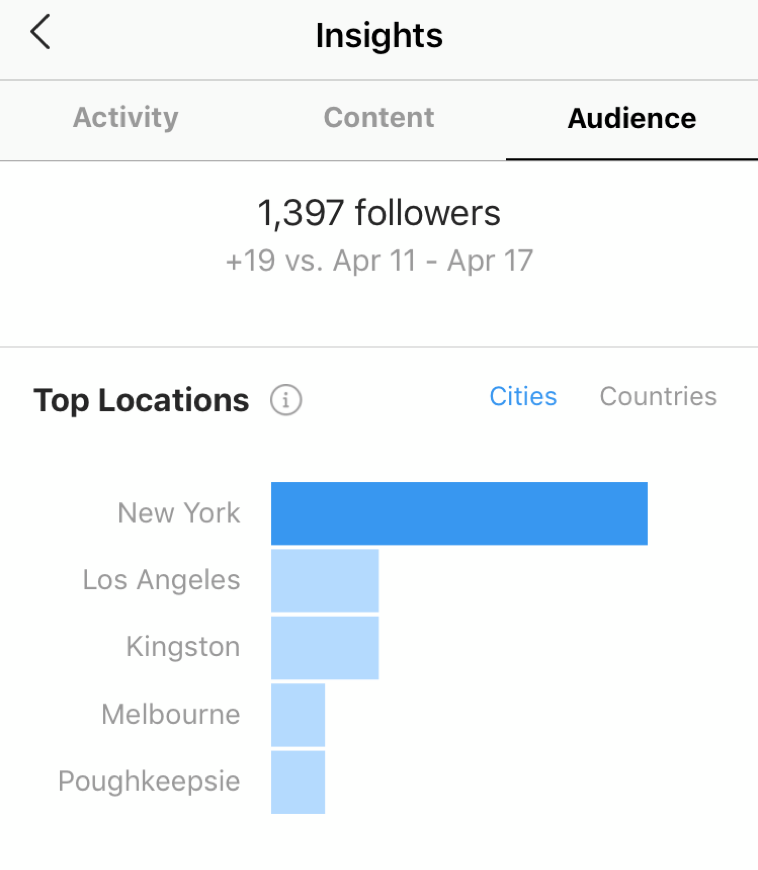
You’ll also get your top locations in your Audience Insights. You can toggle between Cities and Countries and this information can be especially useful if you have a local business. For example, if you sell photography props within a certain radius, but your following is located outside of that radius, you might want to shift your strategy to use more local hashtags or geo-tags.
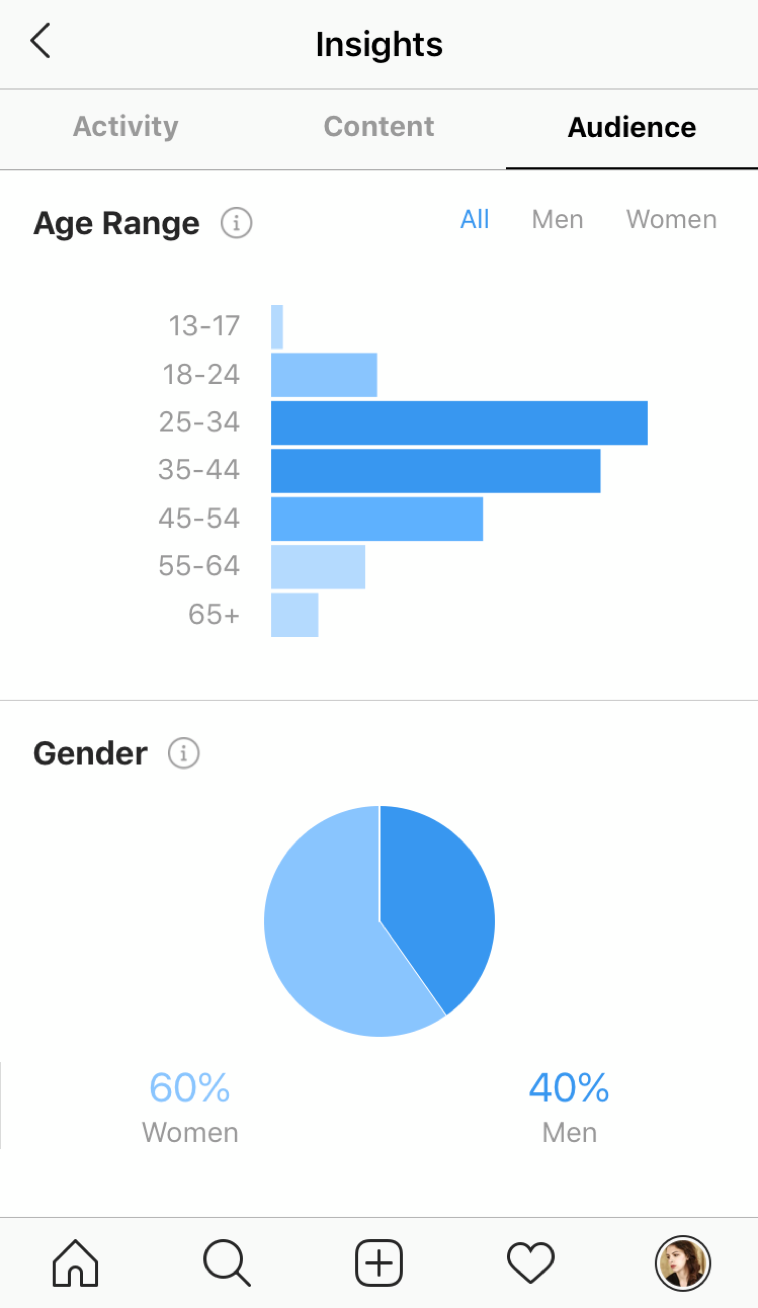
You’ll also get your top age ranges and binary genders. For gender, you can click between Men and Women to see the breakdown. This is particularly helpful in making sure that you’re reaching the audience that you’ve defined in your ideal client avatar exercises.
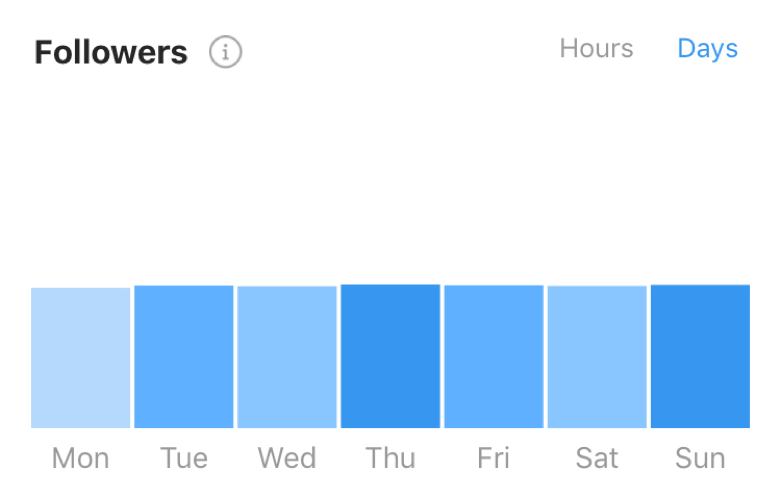
Lastly, Instagram gives you information on when your audience is online. It gives you the breakdown in both Hours and Days. When you’re looking at a breakdown of hours, you can pan through each day to see when your followers are online the most:
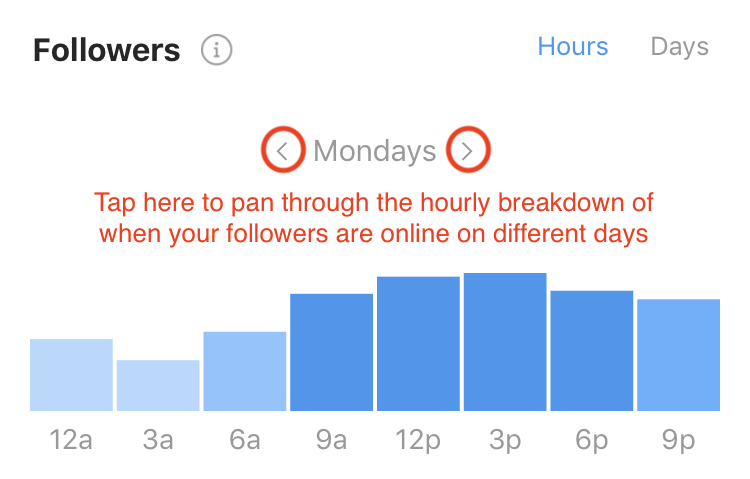
Looking at the breakdown can help you decide which days of the week are most valuable for you to post. Check back regularly because this data changes depending on how users interact with Instagram. In the past, my Insights have said that weekends were slow, but at the time of writing, my Insights say that Sundays are one of the days when my followers are online the most!
Third-Party Instagram Apps
Thus far we’ve mentioned the limitations of Instagram Insights, so it’s only fair to mention some apps that exist to help give us more data. In my research, most of the apps that I’ve found only give you data from the day that you sign up. That means that you won’t be able to see your follower growth over the past six months, for example. But here are some free apps that you can use to supplement your Instagram Insights:
- Pixlee
Once you sign up for Pixlee, it will begin to collect data and send you a weekly report where you can see your top posts, top fans and followers that might be considered influencers for your audience. One slight downfall, however, is that Pixlee is currently unable to provide potentially useful data around hashtag statistics due to a recent Instagram API change. - Socialbakers
This app gives you very helpful data, such as what your most liked and most commented on posts are and what your top performing filters are. You can also use their Instagram Report, which compares your Instagram account to a competitors’. This only works if you both have Business Profiles, but it can help give you valuable insights on what you can improve in your own account! - Union Metrics
While Union Metrics isn’t free, you can sign up for a free monthly Instagram checkup. The checkup lets you know which hashtags are creating engagement and which posts are working the best for you, as well as when your followers are online. Although you only get a 30-day lookback window, this is still much more valuable than the seven days that you get on Instagram Insights! - squarelovin
squarelovin’s free tool gives you most of the information you’d need to track your growth on Instagram. For example, you can get information on the best time to post in the last 90 days, as well as the worst times to posts, and when users are most active. You can also see what your most liked posts are, and what posts got the most comments.
Using Instagram Insights to Make Strategic Decisions
With algorithms making decisions about which posts get seen by your audience and which posts get buried, it’s more important than ever to analyze and understand the data in Instagram Insights! By understanding who your audience is, when they’re online and what content they engage with the most, you’ll no longer feel like you’re trying to navigate Instagram blindly.
Sometimes being on social media can feel like you’re posting to please the algorithms. But those algorithms have been designed to try to help us have the best possible experience when we’re on social media. So if you approach your overall Instagram strategy as trying to provide value to your audience, and look at your Insights as a tool to measure how well that strategy is working, it’s not just a shot in the dark anymore! Instead you’ll be making informed, strategic decisions about what to post and when. By using your Insights as guideposts, you should find that you’re more easily able to achieve your goals and see results on Instagram!