A Photographer’s Introduction to Google Analytics
It’s safe to say that at some point when building your photography website, you were instructed to set up Google Analytics. It’s also a safe bet to say that if you did set it up, you logged in once or twice, and then were immediately overwhelmed with all of the data and charts. That’s ok, it’s a completely understandable feeling.
For the longest time I was terrified of my Google Analytics account and avoided looking into it as much as I could. But once I learned to understand what the data meant, both for my website and my business, I realized what an amazing tool it is! So, in this article we are going to talk about why your Google Analytics is an important backbone of your photography website and how to get incredible insights from it for your business.

What Google Analytics Is and What It Does
At its most basic, Google Analytics is a tool that records the behavior of users on your website. By adding a small piece of code to your site, Google is able to understand how visitors get to your site, what they do there, how long they stay and where they are from. This data – what I will call metrics from here on out – is then sent to your Google Analytics account where you are able to generate reports. Once you’re in your Google Analytics account, you are able to refine that data by using dimensions.
Let’s use a real-world example. Say your website receives, on average, 5,000 visits a month. Those visits are the user data that makes up your metrics. When you log into your Google Analytics account, you are able to generate a report that will let you know what cities those 5,000 visits are coming from. Those cities would be your dimensions.
This data is really useful for anyone that has services in a local market. It helps us to understand what areas of our state or region most of our website traffic is coming from. We could also further refine our data to see that, for example, most of our traffic is coming from females in the tri-state area with a heavy concentration in a certain city. Armed with this information, we can begin to see where we are successful and where we might be missing the mark in finding and reaching our ideal client.
If you want to do a deep dive to understand metrics and dimensions better, check out this support article from Google.
How to Install Google Analytics
Maybe website providers make it simple to get set up by having a space in the back end of your website account to drop a Google Analytics code. With others like WordPress, you’ll need to install a plugin before you can run Google Analytics on your site. So you may already have Google Analytics installed on your website. If you think your site is set up, I still encourage you to triple check! If you’re not set up yet, I’ll show you how easy it is to get Google Analytics onto your site!
- Step 1: Go to https://marketingplatform.google.com/about/analytics/ and click on Start for Free.

- From here, you will be prompted to sign into your Google Account. If you don’t already have one, you will need to sign up for one.

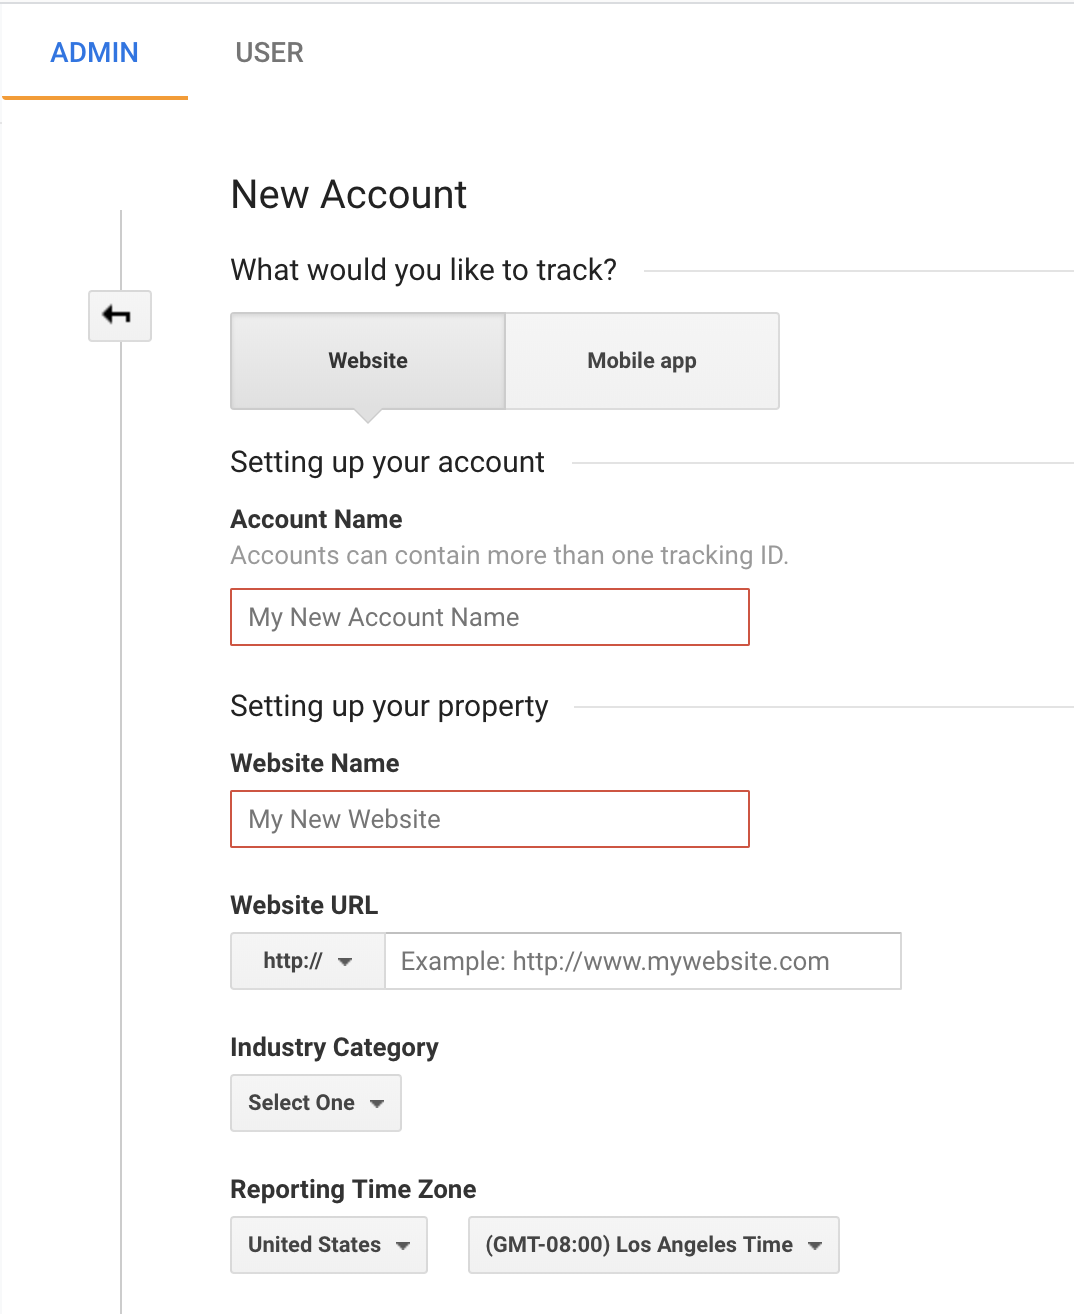
- Step 2: Fill out your website’s information.
- Select Website and name your Account & Property. For this example I am creating an account called “Jen’s Example PHLEARN Account” and a property called “Jen’s PHLEARN Test Site”.
- Make sure that you include the correct version of your website. Google considers https://www.examplewebsite.com and https://examplewebsite.com to be two different sites. So if your website address includes www then make sure you include it here.
- You’ll also make your data more actionable if you change the default time zone to the one you’re located in.
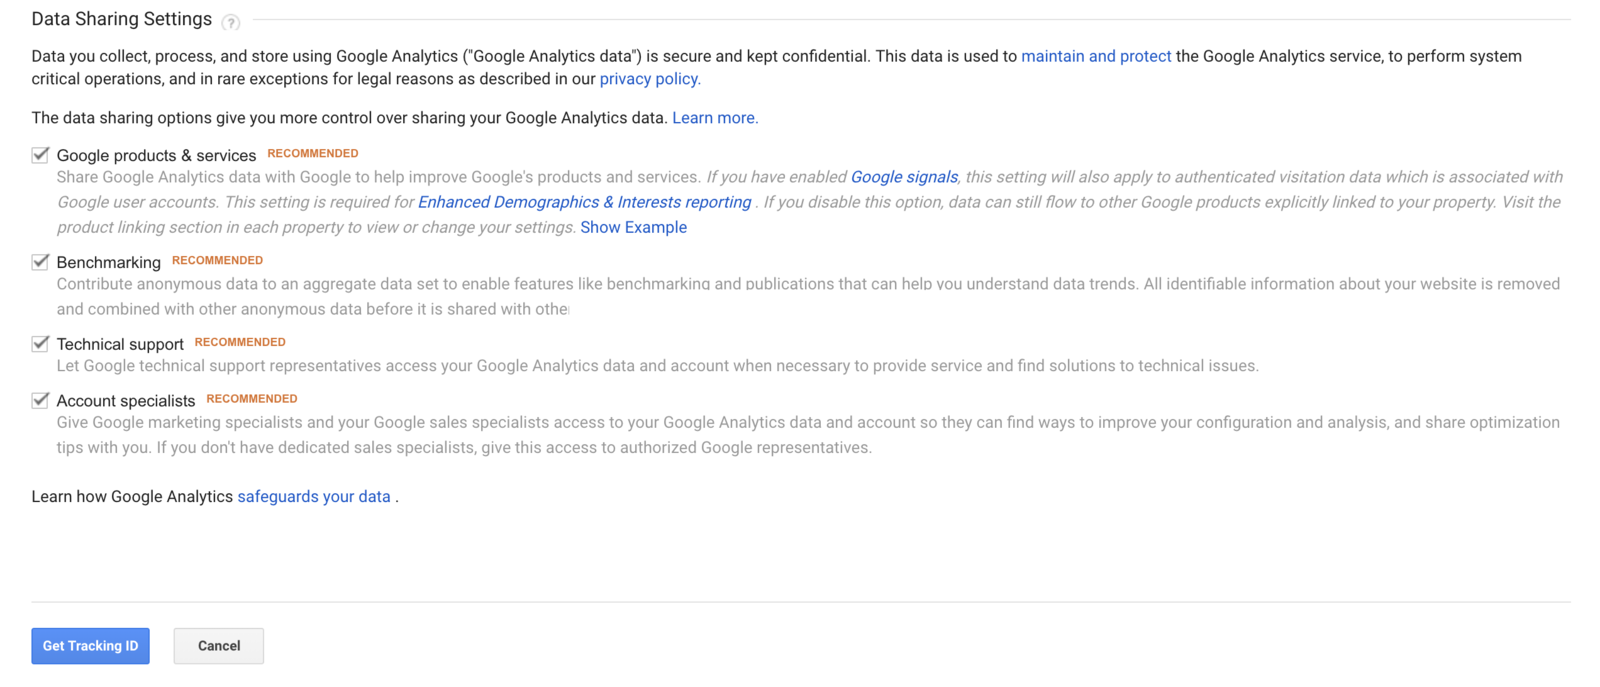
- There are a number of data sharing options as well. You can leave them checked, but unchecking them won’t create any issues with your data.
- Click on Get Tracking ID.
- Step 3: Accept the Google Analytics Terms of Service and the Google Measurement Controller-Controller Data Protection Terms.
- Step 4: Get your Google Analytics Tracking Code.
- To understand your tracking code a little bit better, Google provides the following example: For a property ID UA-10876-1:
- 10876 is the account number.
- 1 is a view within the account. A second view for the same account that tracks an additional property might use UA-10876-2 for the Property ID.
- Some website providers only need you to drop in your Tracking ID, while others will need the entire code. Depending on which your website host asks for, you will copy one or the other.
A Note on Account, Property and View
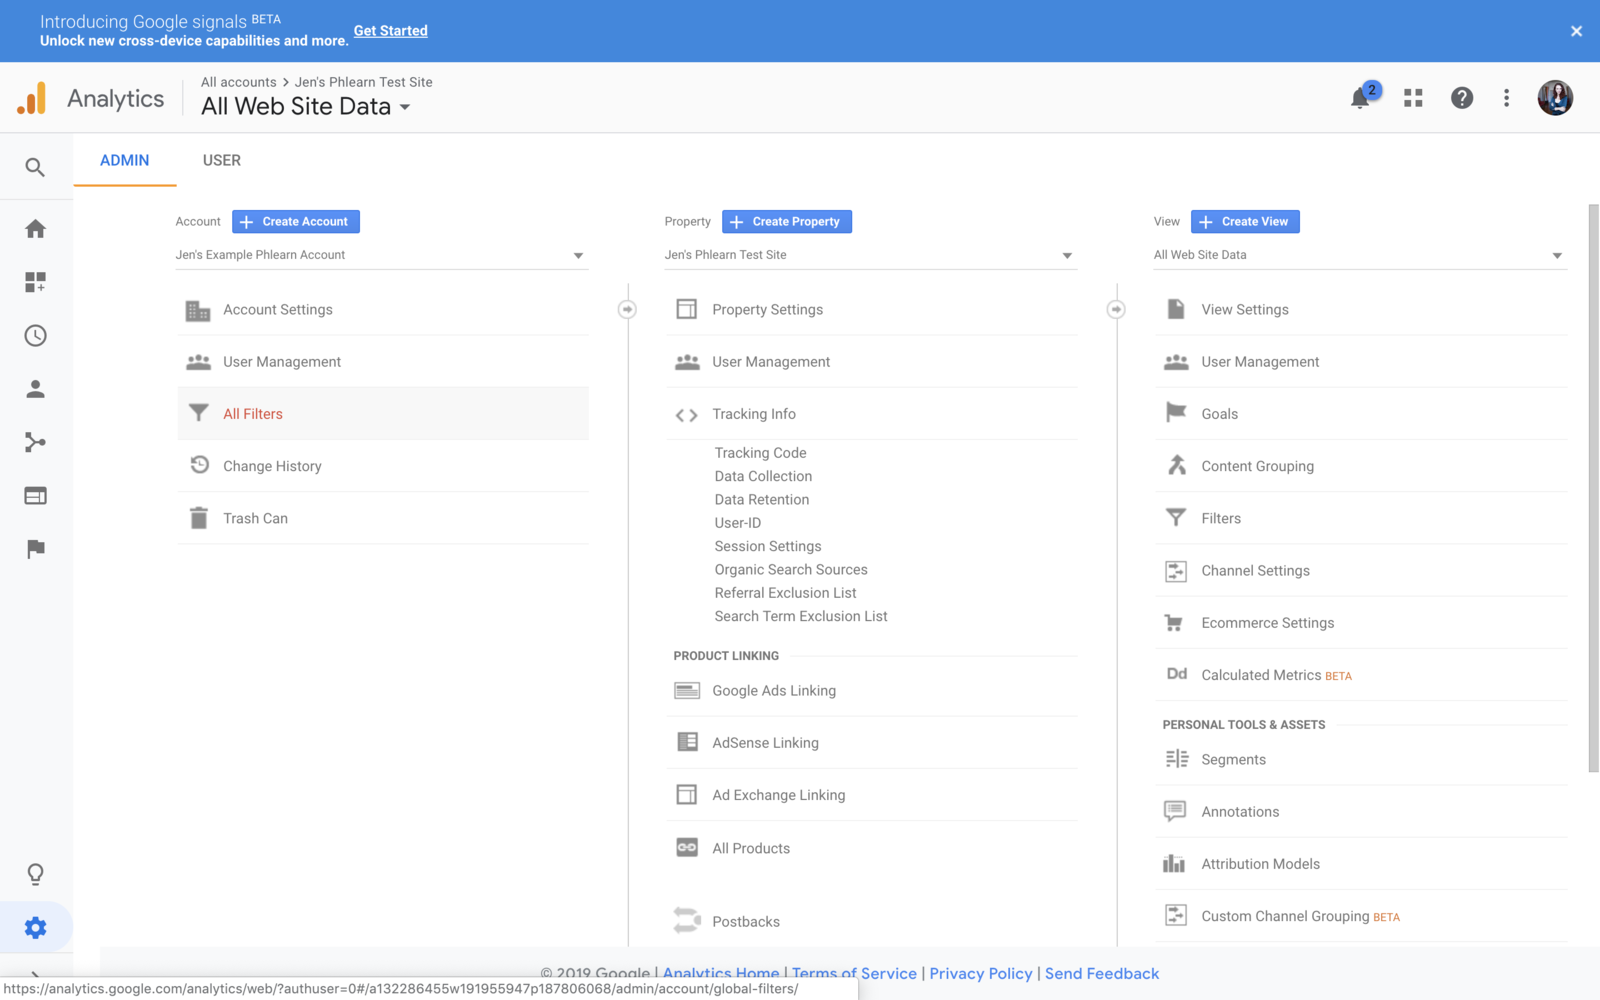
Now that you have your tracking code, I want you to get comfortable with a few things on your Admin Panel before you install your code. On the top left of your screen, you should see a small arrow next to Property Settings. Click on that arrow:
Now you will see three main columns with Account, Property and View at the top:
You might be wondering what the difference is, so we are going to review quickly because it’s important to differentiate for the future.
In Google Analytics, an account is a way of grouping websites together. Chances are you will only need one account. Think of properties as a website or a mobile app. You can have multiple properties in a single account.
Lastly, a view is a way of setting specifications for tracking a website. Setting up a view to filter out our own traffic to our site, for example, is a great best practice!
Here’s a great visual from Google to understand how Account, Property and View differentiate and are used. In this example, “Liz” has both a personal Analytics account and a company account shared with co-workers. Her company account tracks the company website, googleanalytics.com:
- To understand your tracking code a little bit better, Google provides the following example: For a property ID UA-10876-1:

A Quick Tour of Google Analytics
Before we add the code to your site, let’s take a tour around the main Google Analytics interface. That way, you’ll get a better understanding of what kind of information you can find there. Start by clicking the Home button:
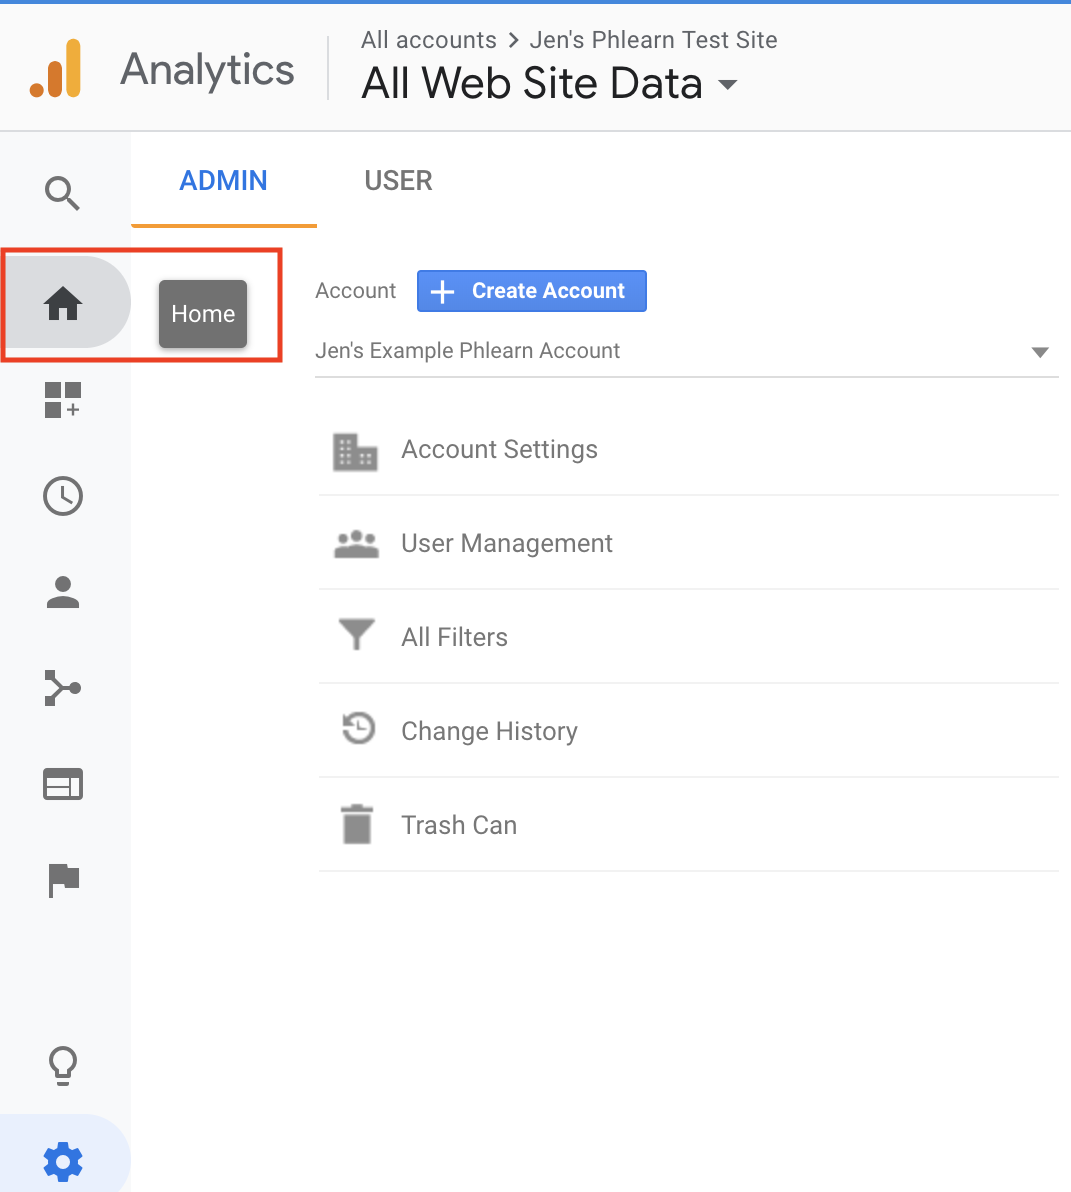
This screen is going to be your main screen every time you log into Google Analytics going forward and is going to give you the main metrics for your site. Right now, because we haven’t installed anything yet, we have zero across the board for all of our metrics.
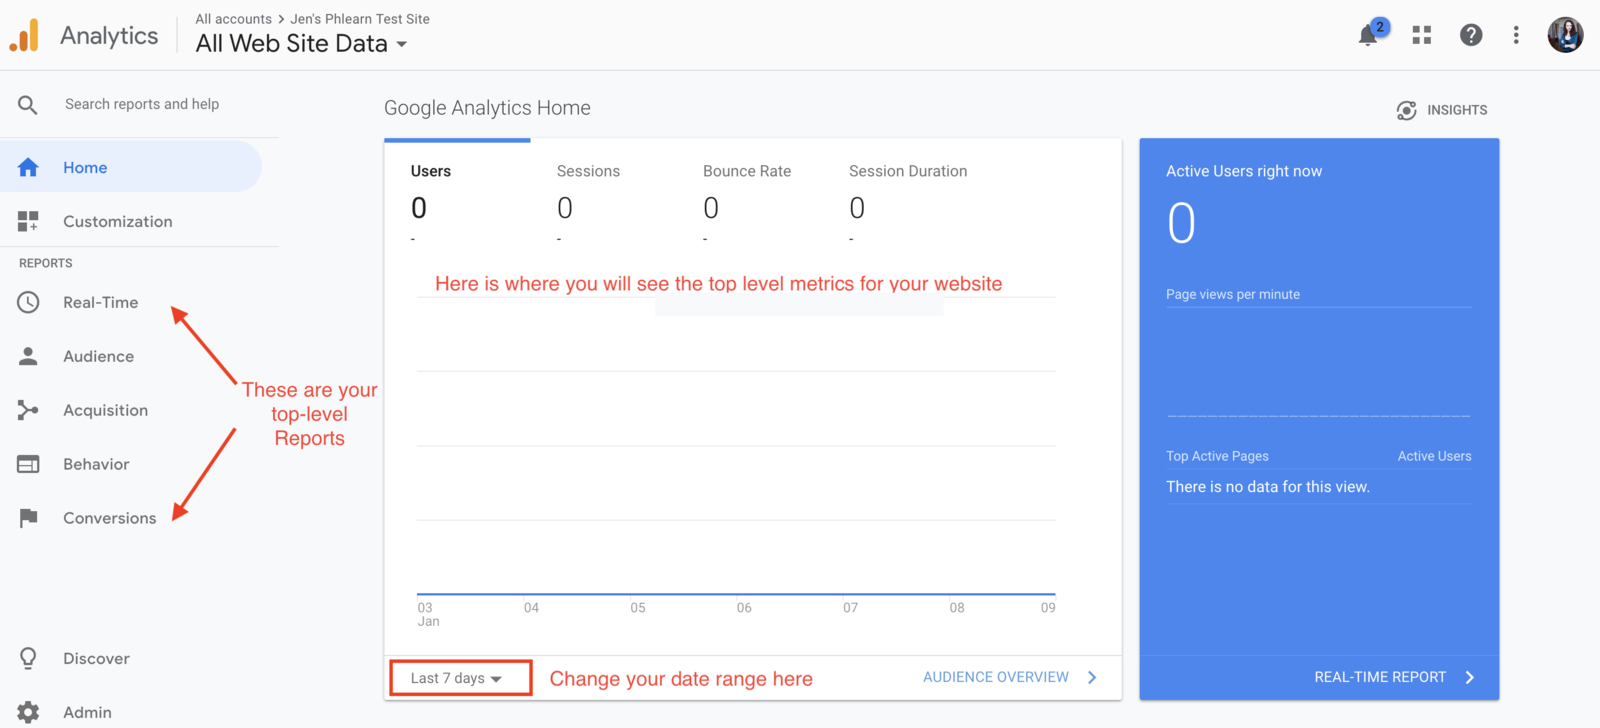
On the left hand side, you will see your default reports. Within each report will be sub-reports, but for now let’s get to know what each top-level report shows us.
- Real-time – This report shows you what is happening on your site at the moment you are observing the report. So when you click on it, you can see many visitors are currently on your site, where they are from, what content they are looking at and more.
- Audience – This report contains information that helps you understand more about your users. Here you will see the number of visitors during a period of time you select, how long they stayed on your site, as well as the demographics of your audience and the technical information about them. This is where you will learn, for example, whether you get more female visitors on their smartphones from Los Angeles, versus male visitors on a desktop.
- Acquisition – This report shows you which marketing channels send visitors to your site and how visitor behaviors differ across these marketing channels.
- Behavior – This is where you will see what your visitors do after they come to your site, the content they look at and more.
- Conversion – If you have Goals set up in Google Analytics, this is where you will see data on how well your website is converting on Goals.
Installing Google Analytics on WordPress
Most WordPress themes will come with a section where you can install your Google Analytics Tracking ID or the full Tracking Code. If you’re running WordPress, check which theme you have installed. A quick Google search should tell you if there’s a simple way to install Google Analytics.
Using the Enfold Theme as an example, you can see that the Google Analytics installation is easily found by going to Enfold Theme Options > Google Services > Google Analytics Tracking Code. From there you will just copy your entire Google Analytics Tracking Code and click on Save all changes.
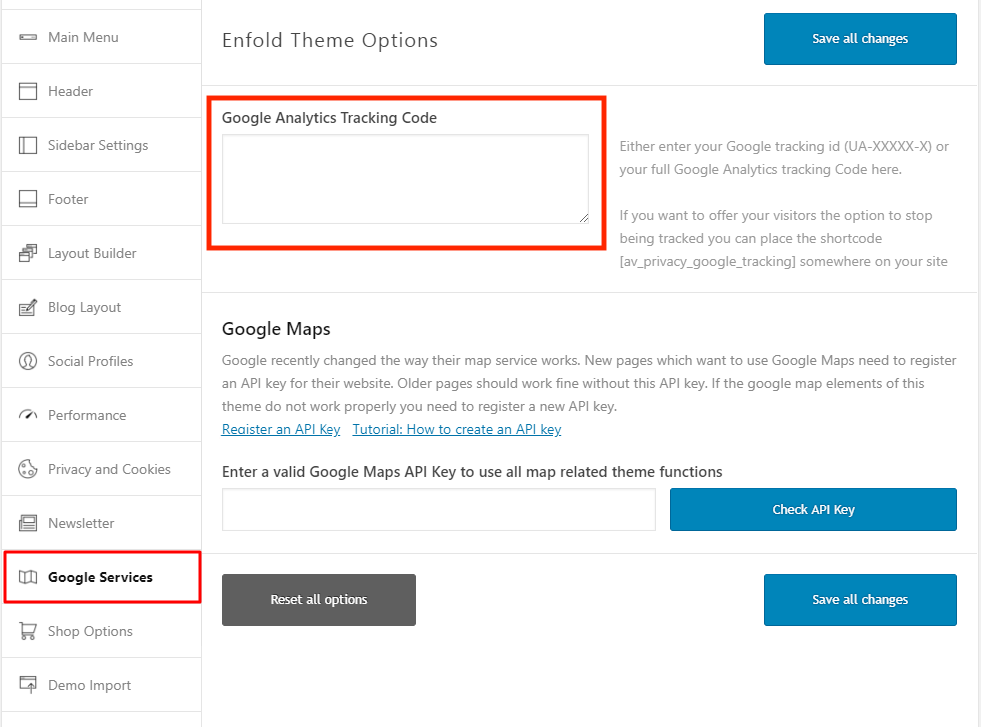
Remember: You can access your Tracking ID in Google Analytics anytime by going to the Admin tab > Tracking Information > Tracking Code.
If your WordPress theme doesn’t allow for an easy installation like this, don’t worry! There are plenty of popular Plugins that can get the job done! Google Analytics by MonsterInsights is currently the most popular and highest rated Google Analytics Plugin for WordPress, with over two million active installs. It has both a free and a premium version, but for your purposes the free version should work just fine. With MonsterInsights, once you have installed the plugin, there are two easy ways to add the Google Analytics tracking code to your site:
- You can authenticate using your Google account
- You can manually paste in your Google Analytics Tracking ID
There are plenty of other great plugins out there that can help you install Google Analytics on your WordPress site. If you would like to research those other plugins, check out this article. Each plugin will also have its own instructions on how to best integrate Google Analytics, so check out the help docs of whatever plugin you ultimately decide on.
Installing Google Analytics on Squarespace
Squarespace sells itself on being easy to use, and their Google Analytics integration is no different! From your Home menu, click on Settings, and then Advanced. Next, click on External API Keys:
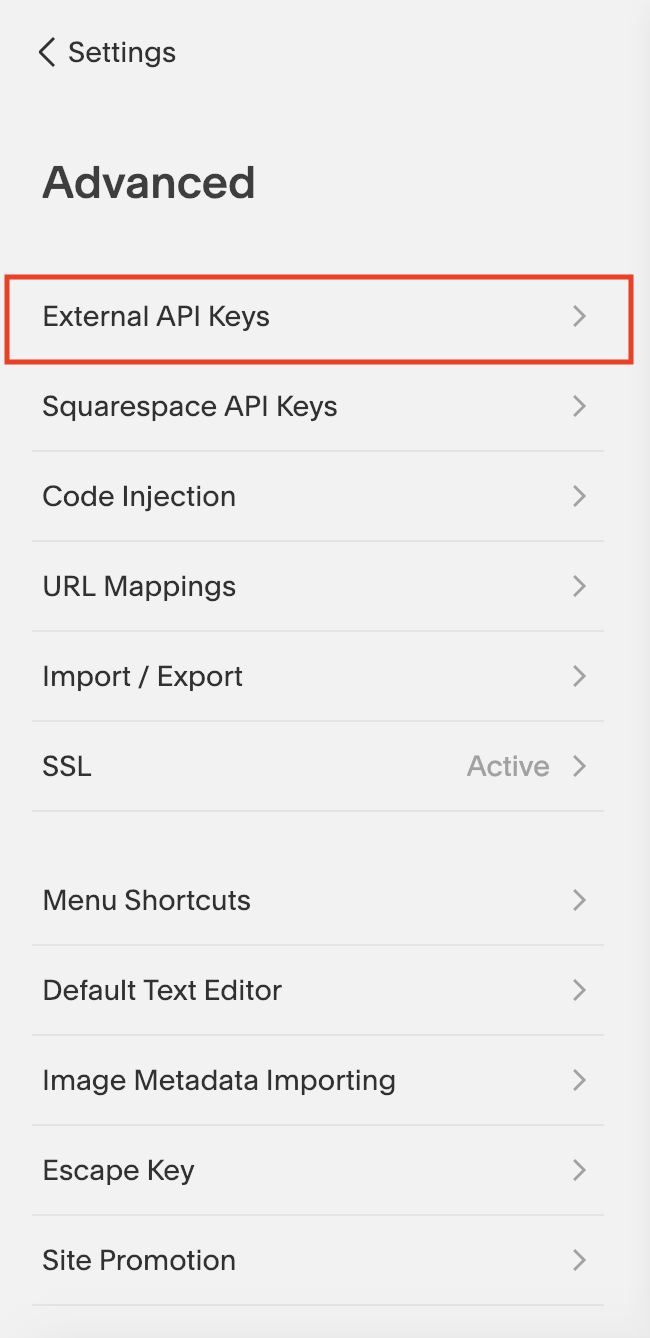
From there, all you need to do is drop in your Google Analytics Tracking ID and you’re all set!
![]()
Installing Google Analytics on SmugMug, PhotoShelter or Zenfolio
There are so many amazing options out there for hosting your photography website, and each one will differ in terms of how to set up a Google Analytics integration. But top sites like SmugMug, PhotoShelter and Zenfolio make it as easy as dropping in your Tracking ID!
SmugMug
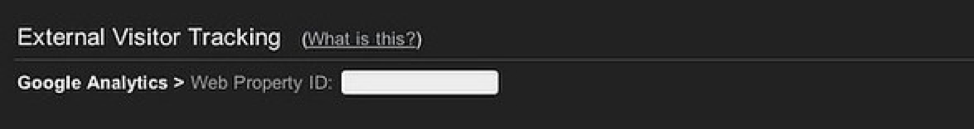
In SmugMug, all you need to do is go into Settings > External Visitor Tracking and then drop in your Google Analytics Tracking ID.
PhotoShelter
With PhotoShelter, the process is just as simple. You will need to navigate to Website > General Settings and then drop in your Tracking ID.
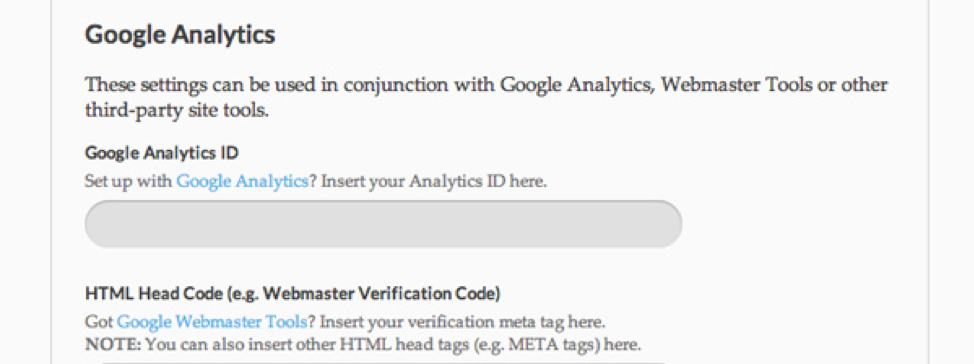
Just note that if you are not using a Custom URL with PhotoShelter, meaning your URL is something like https://[yourlabel].photoshelter.com, then you will want to make sure that your Google Analytics setup matches this correctly. Check out PhotoShelter’s Help Doc if you have any questions.
Zenfolio
To get your Google Analytics up and running with Zenfolio is very simple. Go to your Account > Website > Visitor Tracking.
![]()
Once you are in Visitor Tracking, click on Google Analytics.
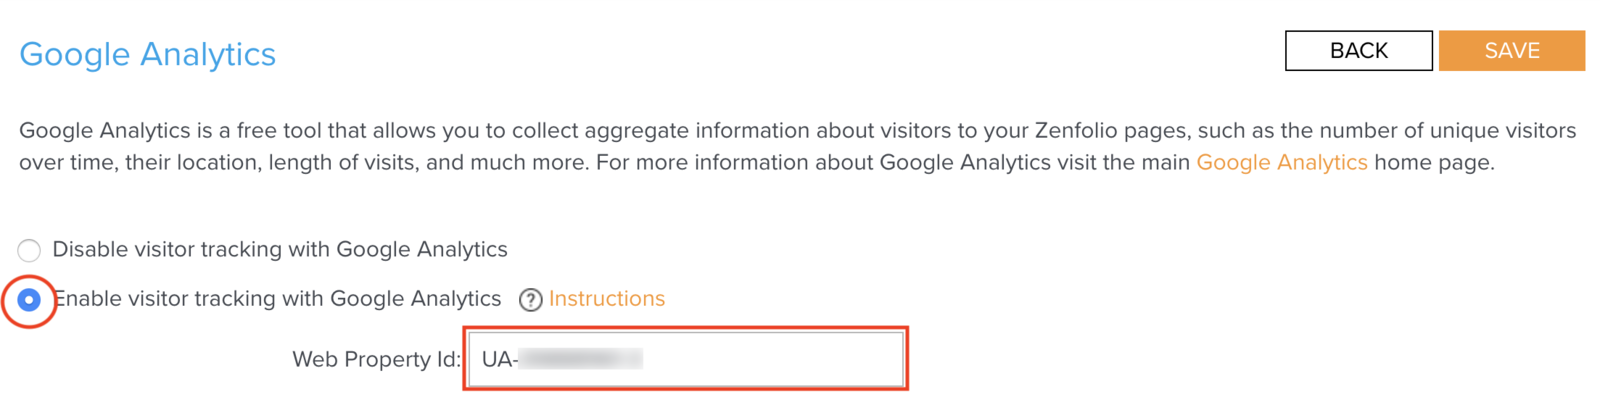
Make sure to select Enable visitor tracking with Google Analytics, then drop in your Tracking ID and click Save.
Other Website Hosting Platforms
There are so many other amazing web hosting platforms out there, and if yours isn’t one of the ones mentioned in this article, don’t worry! Here are some help guides for Showit, Photobiz, BigFolio. If you’re using another provider, a quick Google Search for “setting up Google Analytics with [your platform name]” will probably take you to the help doc you need!
Metrics You Should Be Paying Attention to in Google Analytics
Getting Google Analytics installed on your website is only the first step. Once your Tracking ID is correctly implemented and data begins flowing into your Google Analytics account, you need to know what that data means and what to do with it.
Every time a user comes to your website, Google Analytics installs something called a cookie on their web browser. This is basically a small piece of code that anonymously tracks their web activity for a certain amount of time, or until they clear their browser’s cache. This cookie is the basis of how Google Analytics is able to track your visitors and give you metrics on their behavior.
This data is then placed into the reports we discussed earlier. Let’s take a look at our Audience Report under Overview, as this will give us a top-level view of how your site has been performing for your selected date range. This report gives us a lot of data all at once, and so it’s important to understand what it all means.

- Session – A session, which used to be called a visit, is any activity on your website that occurs within a continuous 30-minute window. For example, if someone comes to your website at 12:00 p.m., and browses through your blog for five minutes before leaving, that activity is recorded as one session. If this same person comes back at 12:20 p.m., Google Analytics will count this as one visit because 30 minutes hasn’t elapsed.
However, if that same person returned to your blog at 6:00 p.m., this would be recorded as two sessions in Google Analytics. The same thing is true if that user first found your blog on their smartphone and then later returned on their laptop, even if it was within the 30-minute time period.
The reason that Google Analytics looks at this as multiple sessions is because the cookie is specific to a browser, not a computer or even a user. Note: in mid-2018, Google began rolling out cross device tracking to Analytics accounts to help get a better user-specific picture. To see if this has rolled out to your account, check out this help doc on activating Google Signals for your data collection.
- Users – This is the number of visitors to your website within a designated date range.
- New Users – Just like it sounds, this is the number of first-time visitors to your site. Now remember, unless you have cross device tracking enabled for your Google Analytics account, this number might include some users who are on different devices than on their first visit.
In our report, it tells us that we have 504 users who have completed 587 sessions within our date range. This means that some of our users have had multiple sessions. We also see that 488 of those users have never been to our site before! This is where the chart New vs Returning Users pulls its data from.
Unless the user clears their browser cache, the Google Analytics cookie will be valid for 18 months. This means that if the visitor browsing your blog were to come back to your website within 18 months, then they are not seen as a new user but, instead, a returning user. Every time that same user revisits your website, then the 18-month cookie window begins again. This is why our sessions are almost always going to be lower than our number of users.
- Bounce Rate – When a user comes to your website and leaves without visiting another page, Google Analytics records this as a bounce. Usually a high bounce rate is indicative of a website not meeting your user’s expectations. Think of a time where you clicked on an article or a link and realized it wasn’t what you were looking for. If you left without browsing through the website a little more, you bounced.
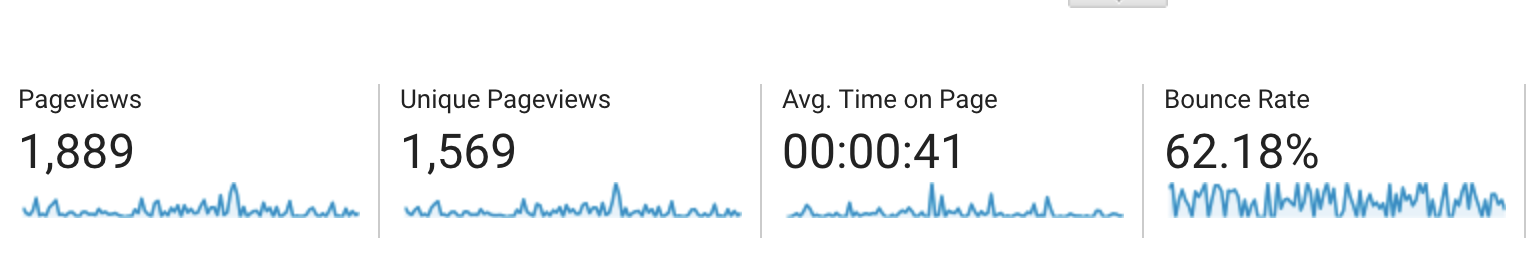
You might ask what a healthy bounce rate is for a website. The answer is that it depends on the industry and the purpose of a page. The below graphic from ConversionXL shows how the website type can vastly affect your bounce rate. So if your website is blog heavy, then the 62.18 percent bounce rate in our above example is not terrible at all!
- Pages per Session – This engagement metric tells you, on average, how many pages on your website users are visiting before leaving.
- Average Session Duration – This metric measures the average time spent on your website and is a good indication of how users are engaging with your website’s content. If they are leaving right away, you know that you have some work to do on creating more engaging content on your site.
- Pageviews – This is a measure of how many pages were viewed within your date range. Every time a user clicks on a different page on your site and the URL changes, a new pageview is recorded.
If you dig into a Behavior report, you are going to see a few metrics that are the same as in our Audience report and a few that are different:
- Unique Pageviews – Sometimes a user will view a page more than once. That’s why we usually see higher pageviews than unique pageviews.
- Average Time on Page –This metric measures how long someone spends on a single page. It is similar to the Average Session Duration report, except that we are looking at a single page’s performance rather than a user’s entire visit.

Setting Up Google Analytics Goals
If there are specific actions that you want users to take when they are on your site, a great way to measure your site’s effectiveness is with Google Analytics Goals. Most photographers want potential clients to fill out a contact form, so we will use this as our example goal. But unless Google Analytics knows what that looks like it will be unable to track it.
The easiest way to set up a goal is to have a thank you page that a user is sent to only after filling out your contact form. By telling Google Analytics that the goal is to have users land on that thank you page, it is able to measure the amount of people completing the form. For example, if your contact form is on yourexamplesite.com/contact, and when someone submits the form the URL changes to yourexamplesite.com/thank you, then we can easily track this as a goal!
The important part is that the URL is changing (remember how we discussed that a pageview is measured when the URL changes?). Unfortunately, some sites have built-in contact forms where the URL doesn’t change after someone submits the contact form. So, I highly recommend testing your contact form to see if the URL changes. If it doesn’t change, it can still be tracked as a goal, but it requires more advanced coding which is beyond the scope of this article.
To set up your goal, copy the URL of your thank you page. Now in your Google Analytics Account, click on the Conversions report. In Overview, you will be prompted to set up your first goal. Click on New Goal.
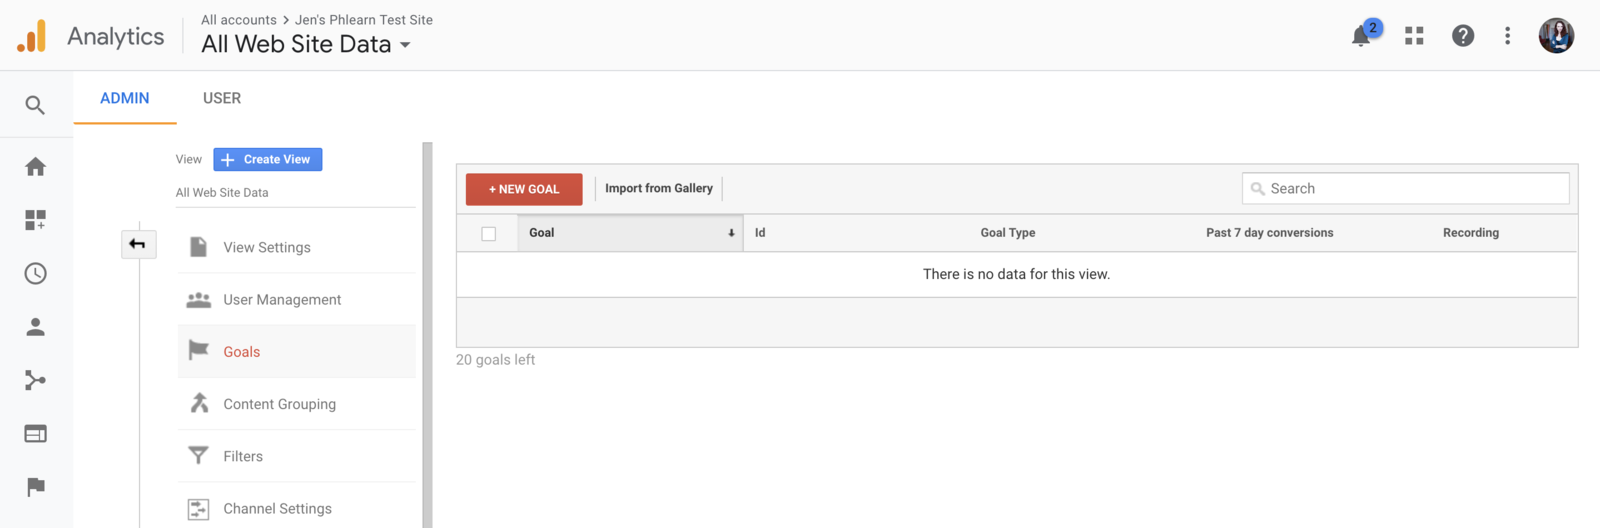
(Later you can set up more goals by clicking the gear icon in the bottom left of your screen which will take you to your Admin panel. Then under View, click on Goals.)
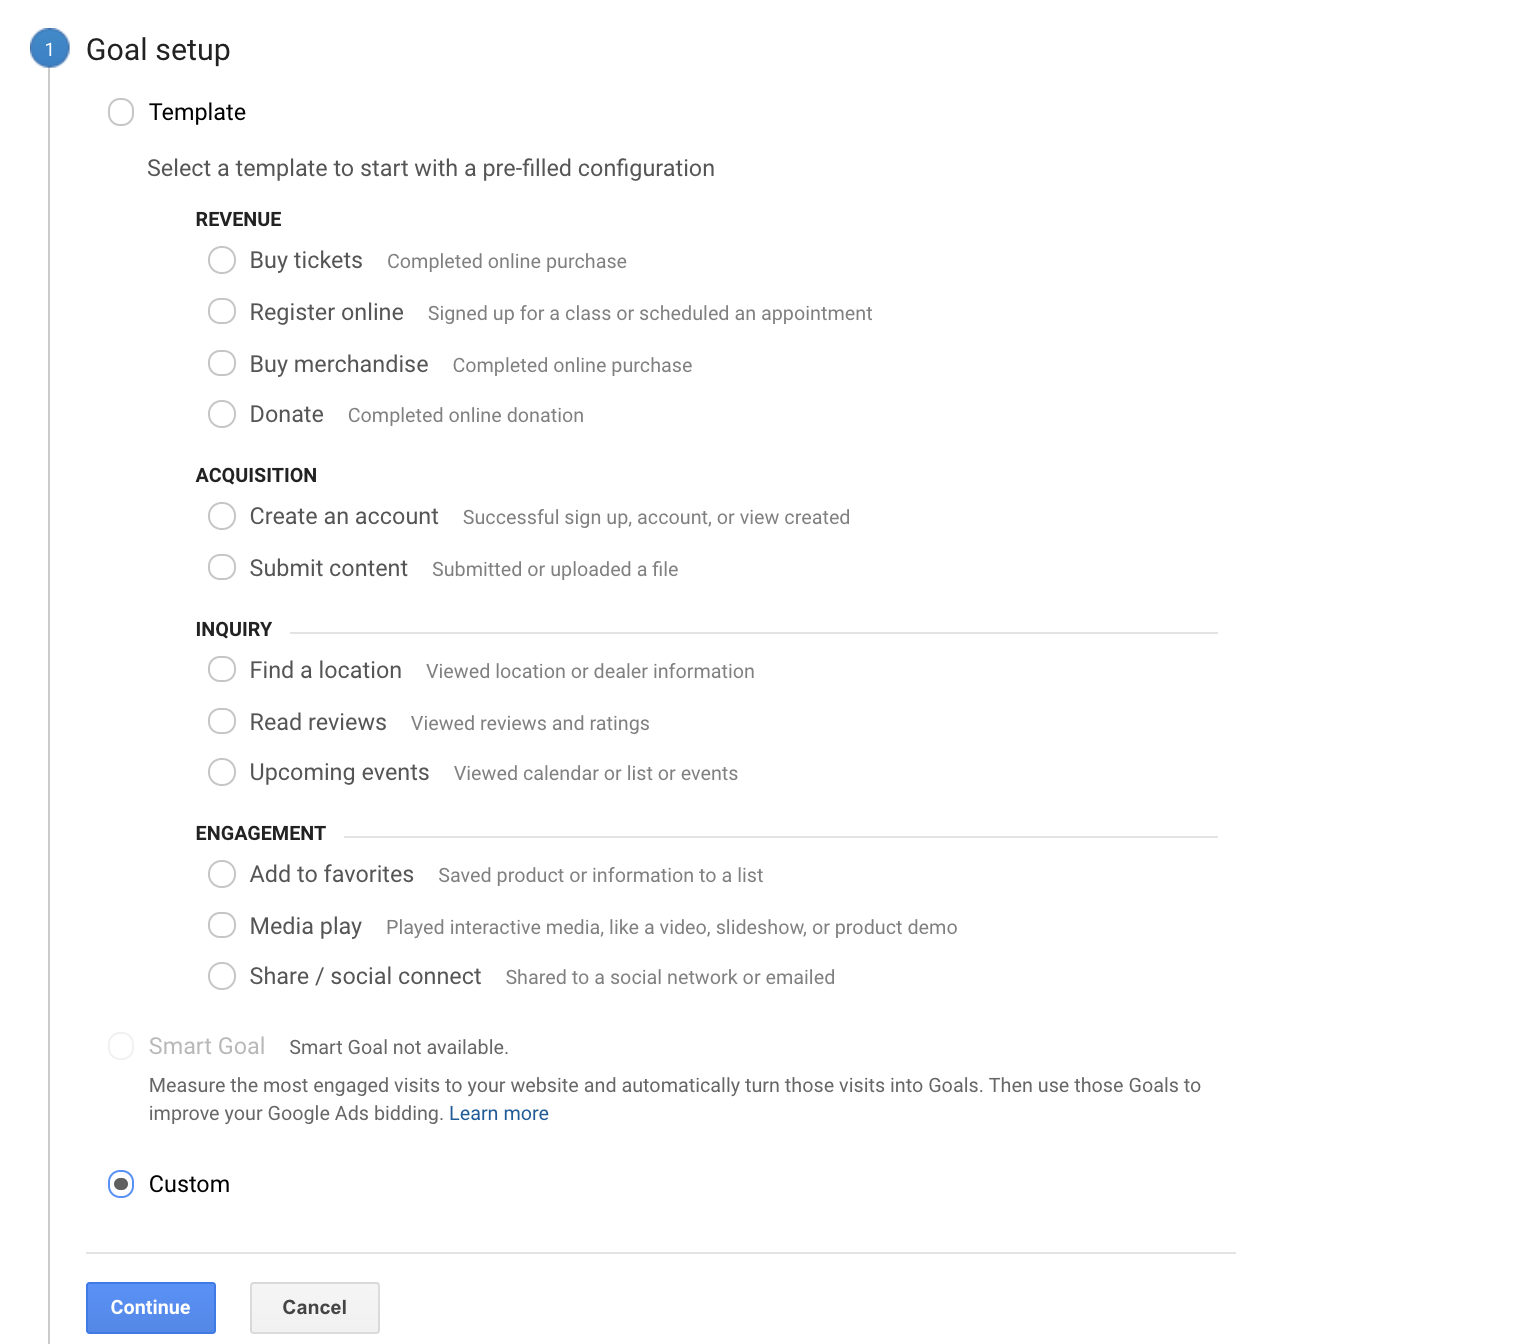
Under Goal setup, you can either choose a Template goal that fits your specific situation, or click on Custom. For a contact form submission, Register online or Custom could work. I’m going to go with Custom. Hit Continue.
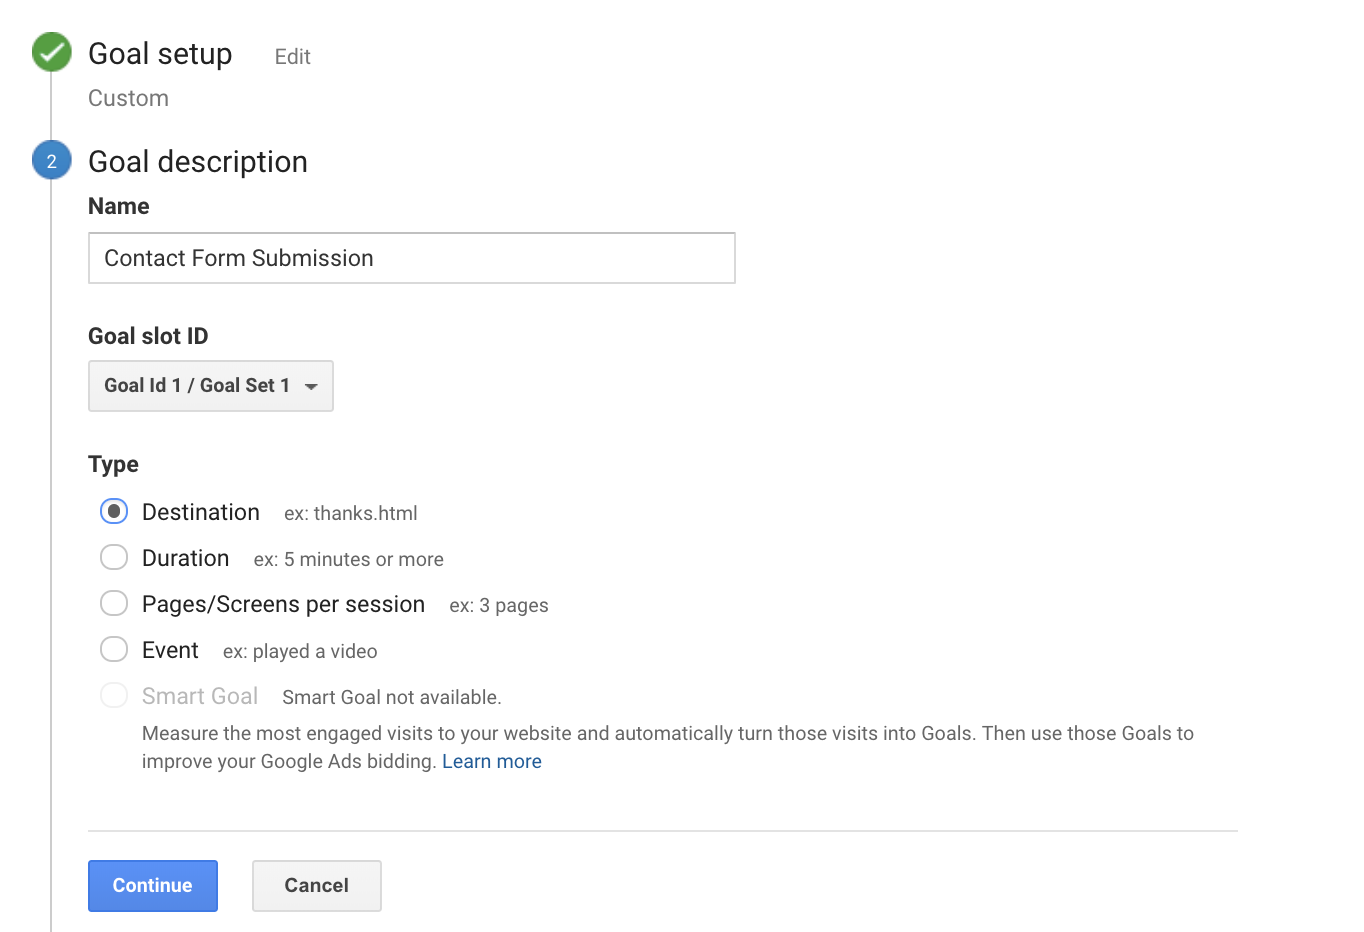
Next, you will be prompted to fill out information about your goal. I’ve named mine “Contact Form Submission.” Because we will be using a thank you page to set this goal up, click on Destination for your type. Hit Continue.
Under Goal details, paste the thank you page URL that you came to after testing your contact form. Click Save.

You’re done! Give your site some time to collect data. When you return, you can go into your Conversions > Overview report to see what percentage of your users are completing this goal. Like bounce rate, the conversion rate of every site is going to be different. But if you see that your site is converting about two percent of your visitors then you know you’re on the right track. If you see numbers lower than this, it’s a great opportunity to think about how to make it so that the content on your site encourages users towards the goals you have for your site!
In Conclusion
Installing Google Analytics on your photography website is a great way to keep a pulse of how your website is working for your business! But it’s not just enough to be tracking the metrics. Understanding what the metrics mean can also help you to improve your website and, in turn, interest more visitors in the services that you have to offer!
In future articles, we will take deeper dives into the various reports available in Google Analytics and talk about how to use that data to understand how users are experiencing your site. But for now, the fact that you have installed Google Analytics to your site, gotten familiar with basic metrics and set up your first goal is amazing! High fives all around!