The Photographer’s Guide to Using Facebook Insights in Your Social Media Marketing
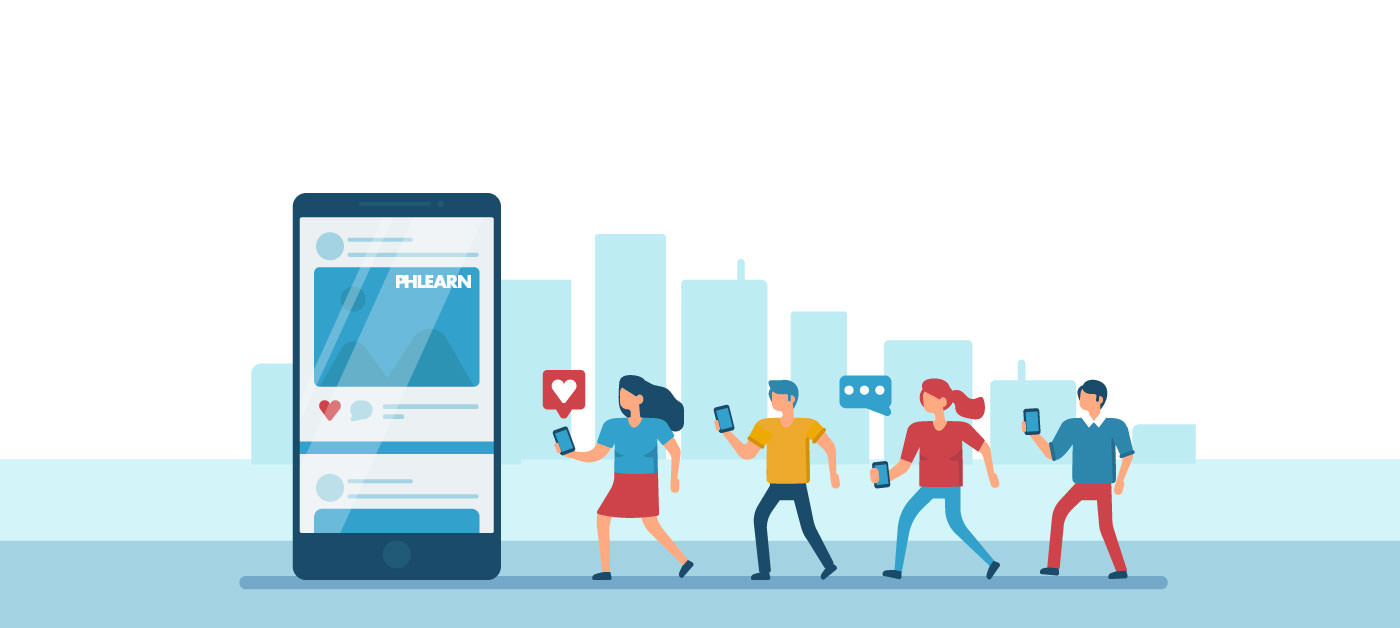
You already know that if you want to grow your photography business on social media, then Facebook is one of the most important places for you to show up. Hands down, it is one of the most important social networks in the world. Because almost everyone we know has a Facebook profile, it means that the likelihood of being able to find photography clients there is high. And with users spending close to an hour a day on the platform, there are plenty of opportunities to get in front of the right people!
The problem for many of us is that we feel like our marketing efforts on Facebook are often a shot in the dark, fumbling to see what kinds of posts will get engagement and what won’t. So many photographers feel at the mercy of complex algorithms that limit their posts, and thus their ability to grow their business with Facebook. And while we can’t change the algorithms that govern Facebook, we can pay attention to what works and refine our strategies over time.
Luckily, Facebook provides highly detailed analytics and insights on pages and posts to help you in that effort. If you have been using Facebook as a part of your marketing mix, but haven’t dug into the insights that they provide, here is what you need to know!
What Is Facebook Insights?
Facebook Insights is a robust tool that is given to all admins of Facebook Business Pages, and it gives you the ability to understand how your Page and its content is performing. It will let you track the number of fans your Page has, when they are online and where you are gaining new followers. It will also give you insight into what the best time of the day to post is, what day of the week has been working best for your posts and which content has been the most engaging to your audience.
Why Use Facebook Insights?
In 2018, Facebook made big changes to its algorithm and announced that it would begin to prioritize content from users’ family and friends. This was a big blow to businesses because it meant that it can be even harder to reach your audience on Facebook. However, one thing that we highlighted in our Facebook Marketing Guide was that according to Facebook, they are looking to highlight content that they deem creates a meaningful interaction.
This is where Facebook Insights comes in handy. Using it to understand your Facebook Page’s metrics will give you the data and insight that you need to make sure your posts are creating the meaningful interactions that Facebook is looking for. By using Insights, you can put yourself back into the driver’s seat of your Facebook marketing strategy instead of sending posts into the void and crossing your fingers that the algorithm will be kind.
How to Use Facebook Insights
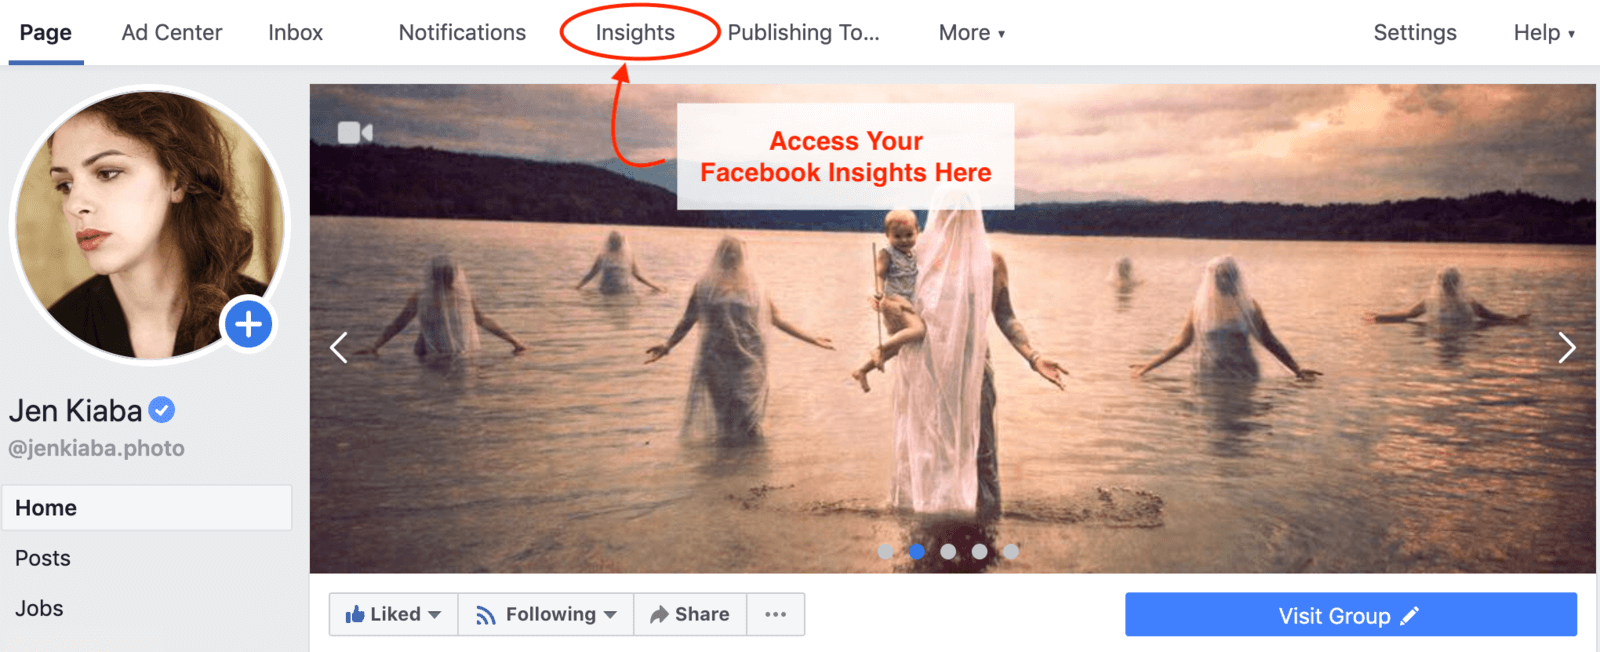
Insights are accessible at the top of your Facebook navigation bar when you’re on a Facebook Page that you admin.
From your Insights tab, you will be brought to the Overview section where you will find a wealth of data. This could be considered the 10,000-foot view of how your Business Page has been performing. By default, you will see data for the last seven days, but you can open up the timeframe to 28 days.
Facebook Insights Overview
Let’s dive into the data I see in my Overview tab to understand how my Page has been performing. I have a fanbase on the smaller side with less than 6,500 followers, and post, on average, three times a week. This could be considered infrequent as compared to larger brands and businesses, so I’m working with a smaller data pool. If you also have a smaller fan base, you may find that your Insights are limited especially around demographic information of your followers. This is because Facebook makes it a policy to not reveal demographic information for audiences or audience segments under 1,000.
So if you have a smaller audience, or also post infrequently, you may find that some data points will say “insufficient data.” This just means that you may need to up your post frequency and work on growing your audience before you can use your data.
Page Summary
The first thing you will see in your Overview is the Page Summary. This is broken down into the top metrics that Facebook considers important. We will dive into most of these metrics more in depth, but for now, know that you can keep a pulse on your performance here.
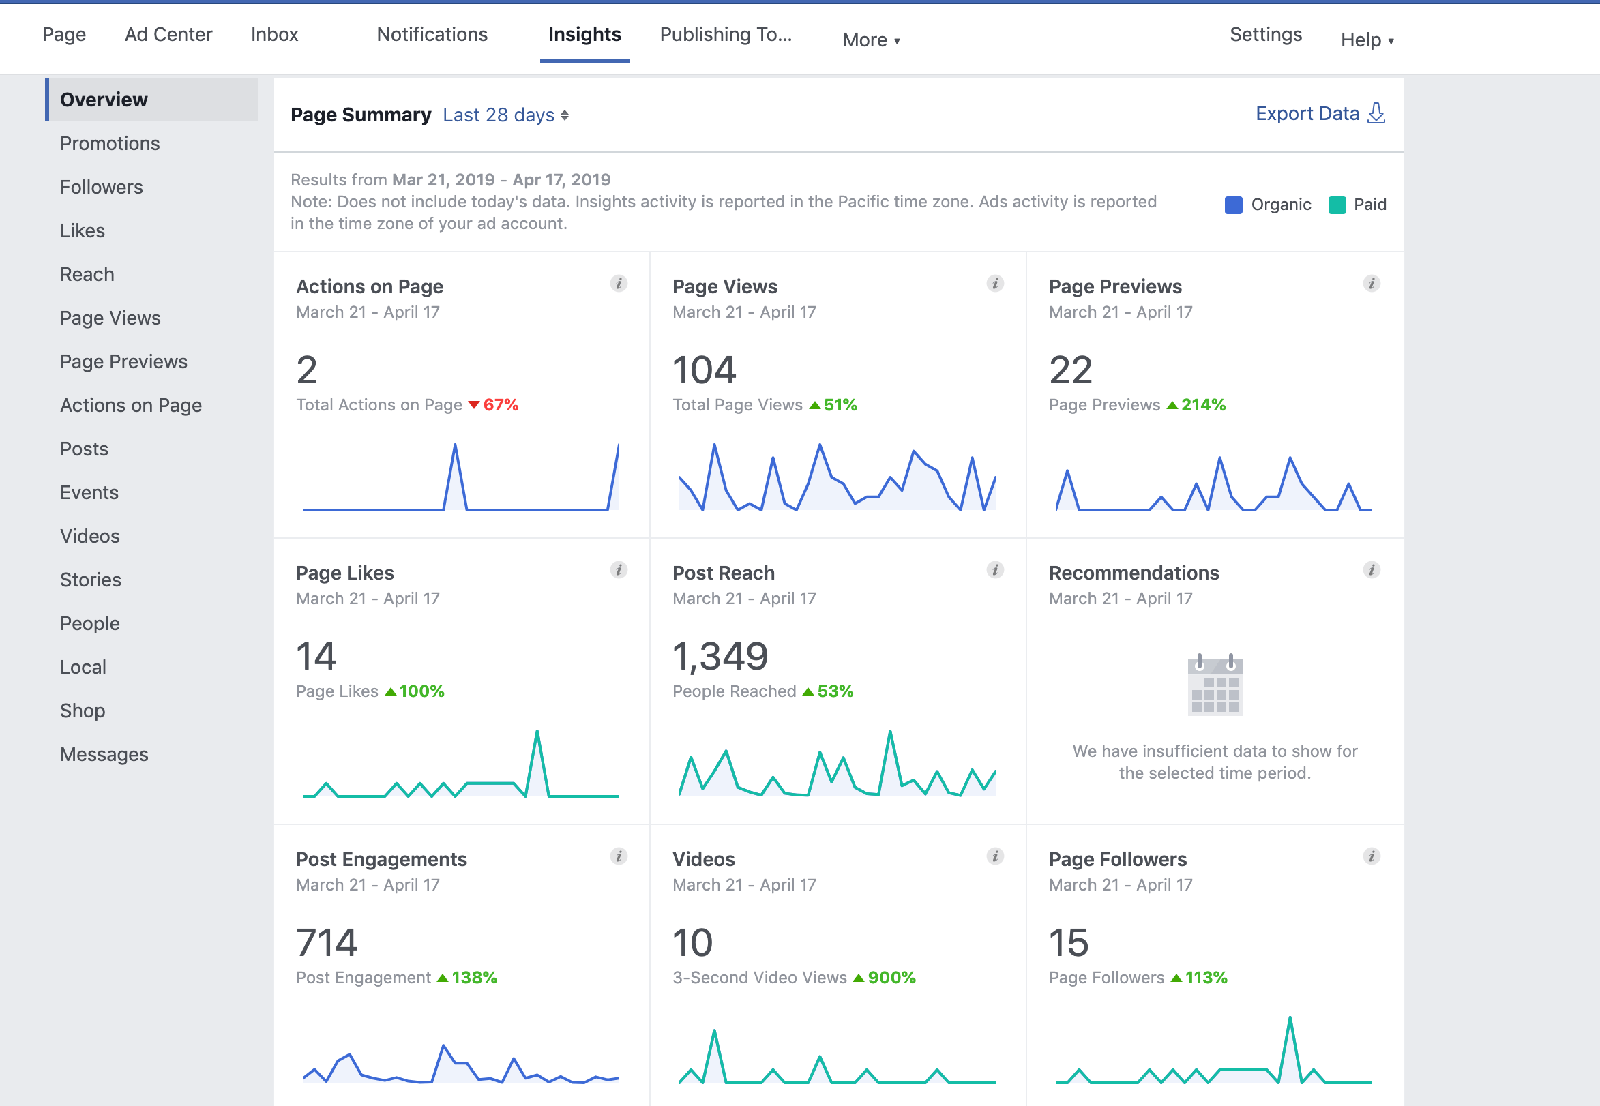
In my Overview, I have opened up the timeframe to the 28-day max in order to see any trends that might have occurred. The line graphs displayed in the Overview section can help me see where my lulls occurred and where I have a spike in activity.
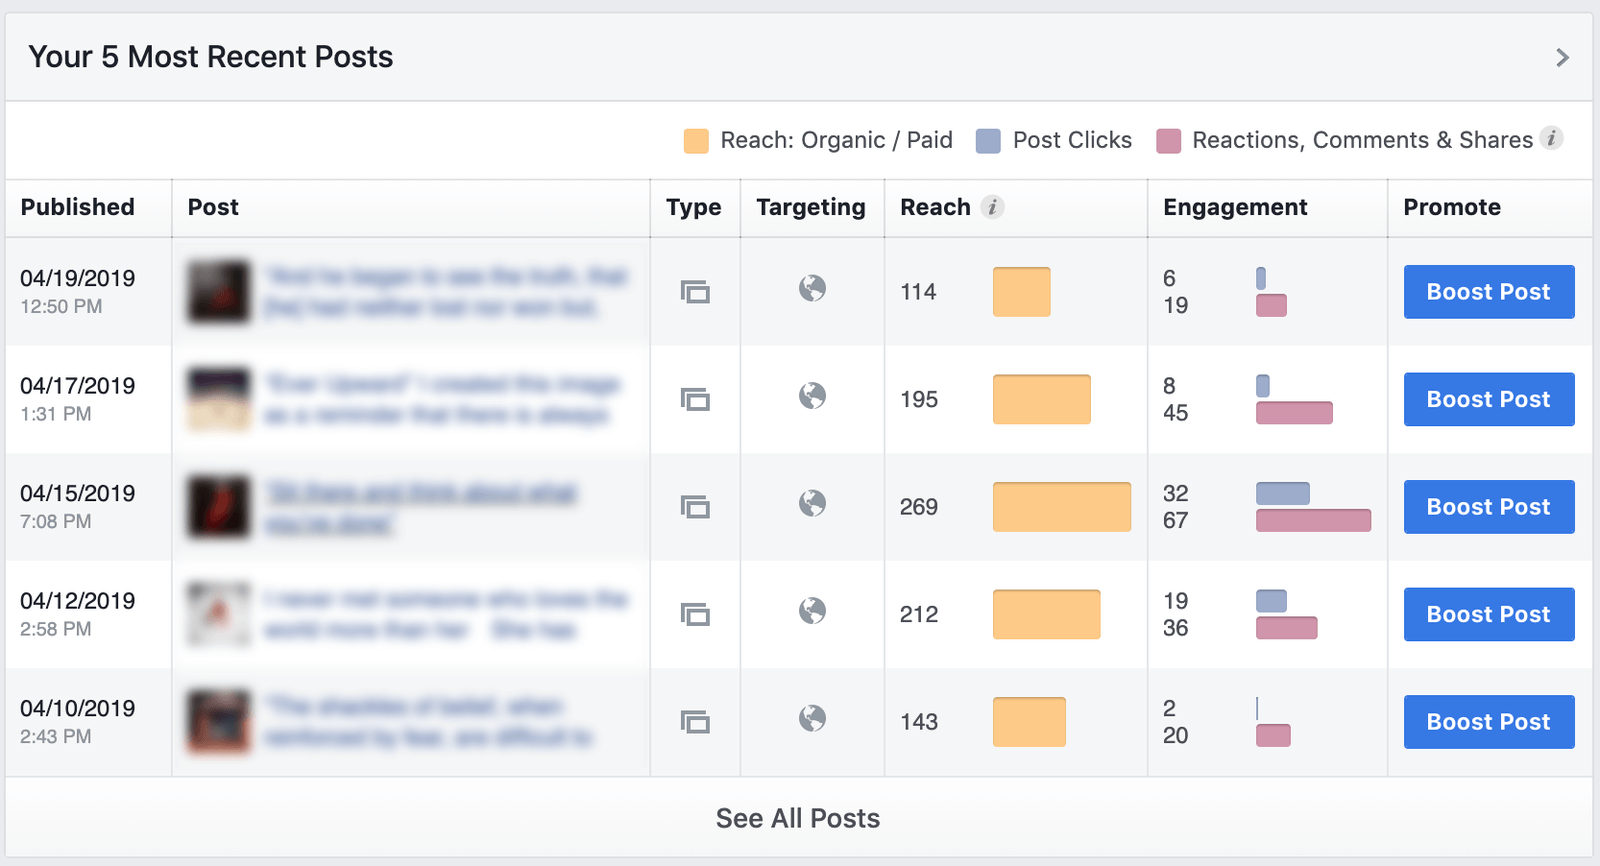
Your Five Most Recent Posts
When you scroll down in your Overview, you will see the five most recent posts to your Page. This is a good place to see how your recent posts have performed. Personally, I like to look back a little further than my last five posts, so I tend to click on See All Posts. We will talk about Post performance later in this article.
Pages to Watch
Facebook allows you to choose Pages that you consider to be competitors or industry leaders, to keep tabs on how many posts they had the past week and how much engagement they got. Because I am watching a few Facebook Pages from leaders in the photography industry (positions #1 and #2 in the image below), it makes my engagement data seem pale in comparison. But I find them valuable to watch to see how often they are posting, what they are posting and how much engagement they are getting so that I can learn from them.
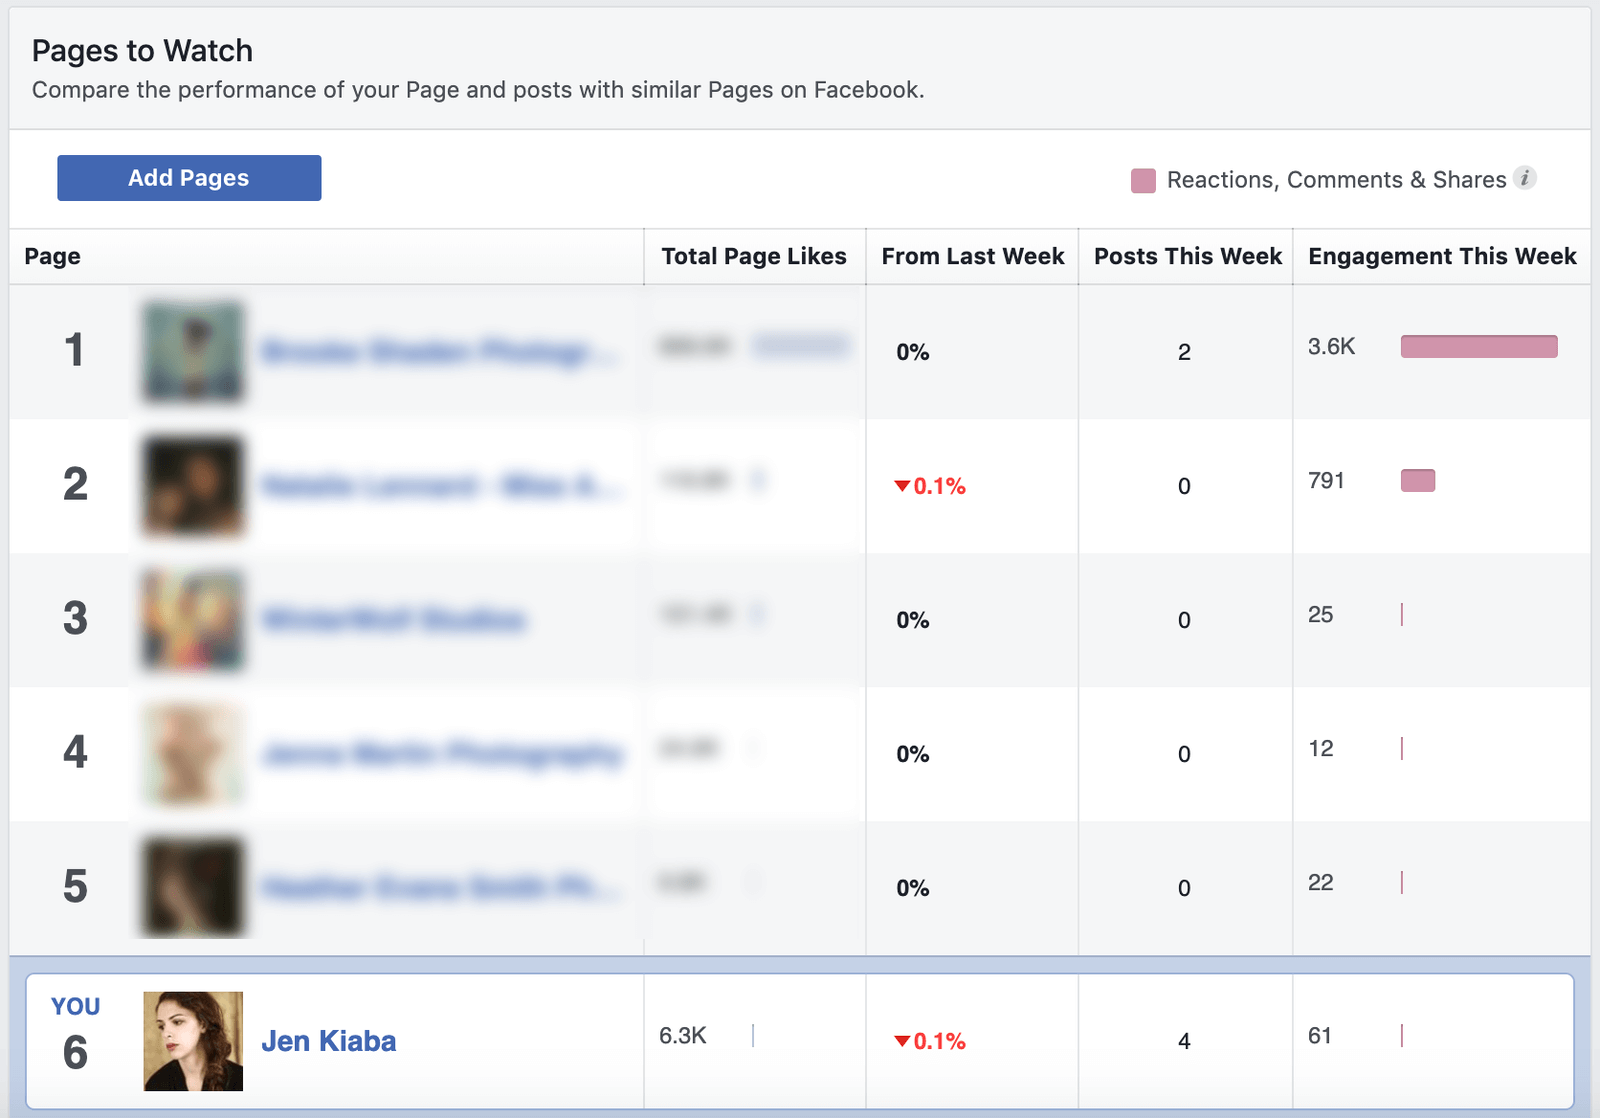
Later, I will show you how you can see the top posts from Pages you watch.
Some data points in your Insights Overview are more meaningful than others, so let’s define them so that you can decide which ones will be useful to your photography business.
Actions on Page
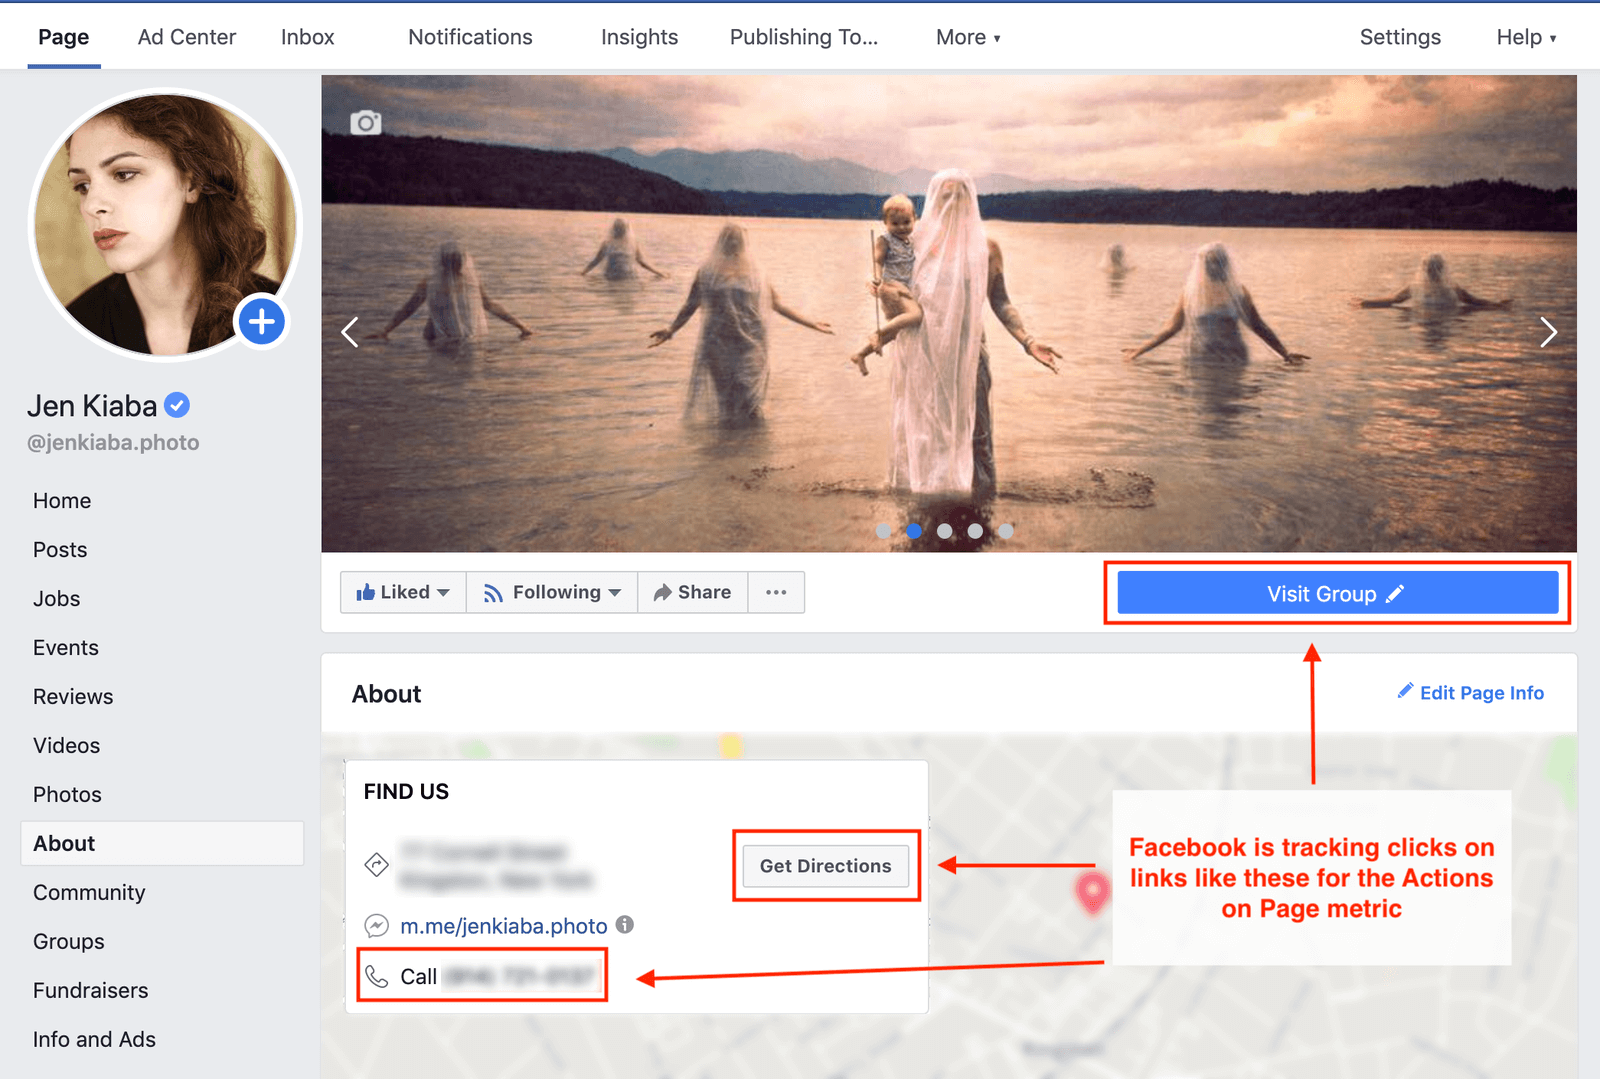
The first data graph we see on the top left-hand side of our Overview is Actions on Page. Facebook defines this as: “The number of clicks on your Page’s contact info and call-to-action button.” This means that in the About section of your Page, Facebook is tracking clicks on the Get Directions button, as well as clicks on your phone number and website.
If I click on the small Actions on Page graph in my Overview, it will take me to more in-depth data where I can open up my date range even further. In the below screenshot I’ve opened up my date range to show me the last quarter’s worth of data. As we can see, there still isn’t much. A few people have clicked on my website from my About Page and one person has clicked on the call to action to join my Facebook Group.
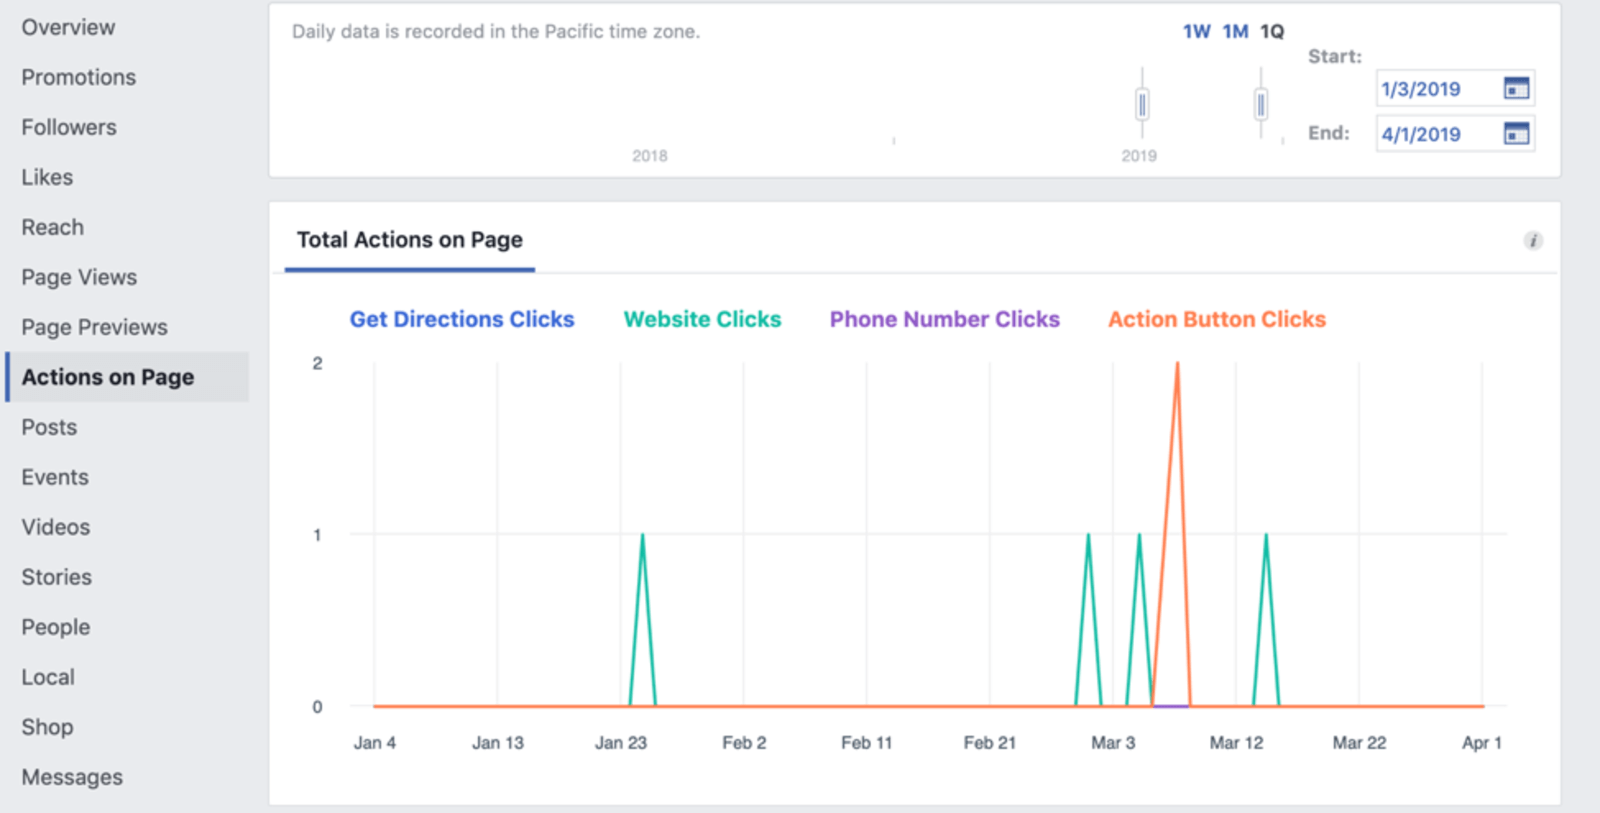
Because I am using Facebook as an Awareness channel, I’m not too worried about this data. Most of my posts are not asking my audience to call me, visit my studio or even visit my website. For the most part, I am looking to create engagement and community on Facebook. However, if you’re looking for more web traffic from Facebook and you are seeing numbers like mine, you may want to assess your posts and their calls to action. Benchmark the data you are seeing now and then track your data moving forward to see if it improves as you adjust your strategy.
Page Views
The next small graph in my Overview is Page Views. Facebook defines this metric as the number of times a Page’s profile has been viewed by both people logged in and logged out of it. I can see that for the past 28 days, I have gotten 104 Page Views, and this is up by 51 percent over the prior 28 days. If I click on this graph, I am taken to a more in-depth Page Views section and can see both my total views and the sections of my Page that got the most views. Overall, the Home view of my Page is getting the most visibility but I can also see that people are interested in my Photos and my Groups to some degree:
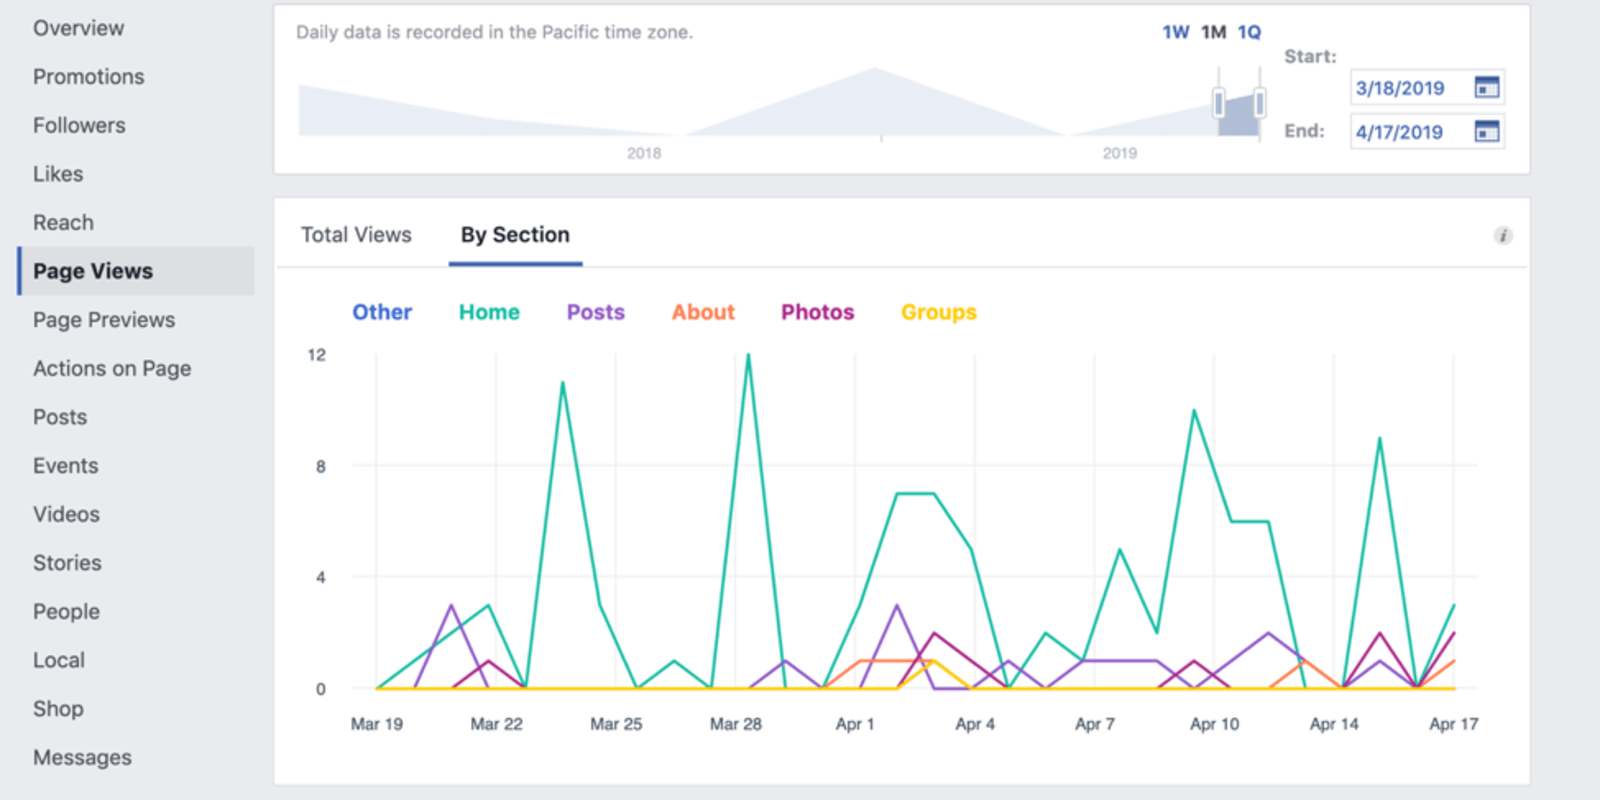
Because it’s a small data set, Facebook won’t let me see information on the demographics of my Page viewers. But I can scroll down in this section to see the biggest traffic sources for my Page, and by far internal Facebook traffic is my biggest referrer:
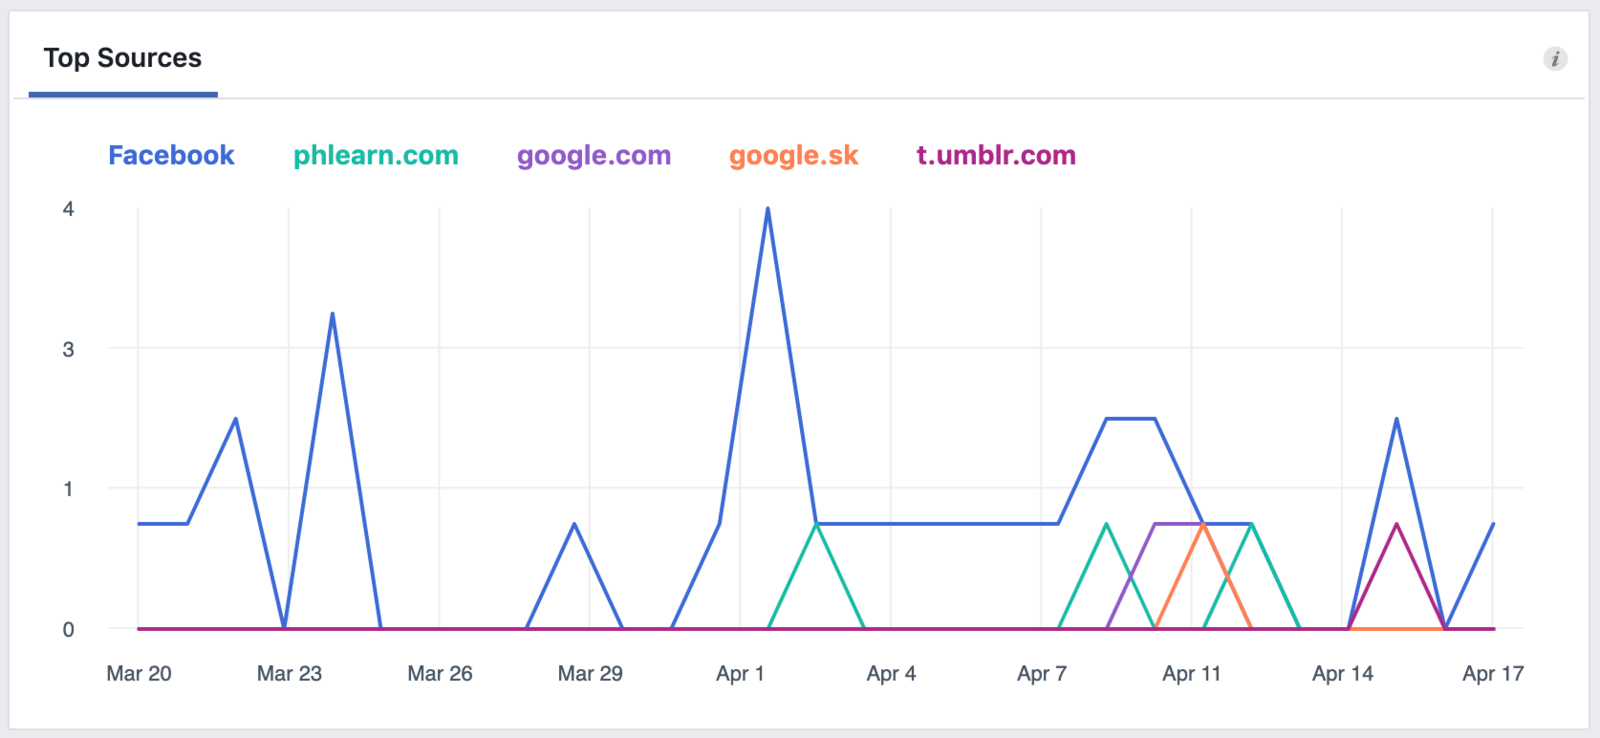
The other referral sources let me know that search engines like Google and websites like Tumblr and PHLEARN have sent some traffic my way.
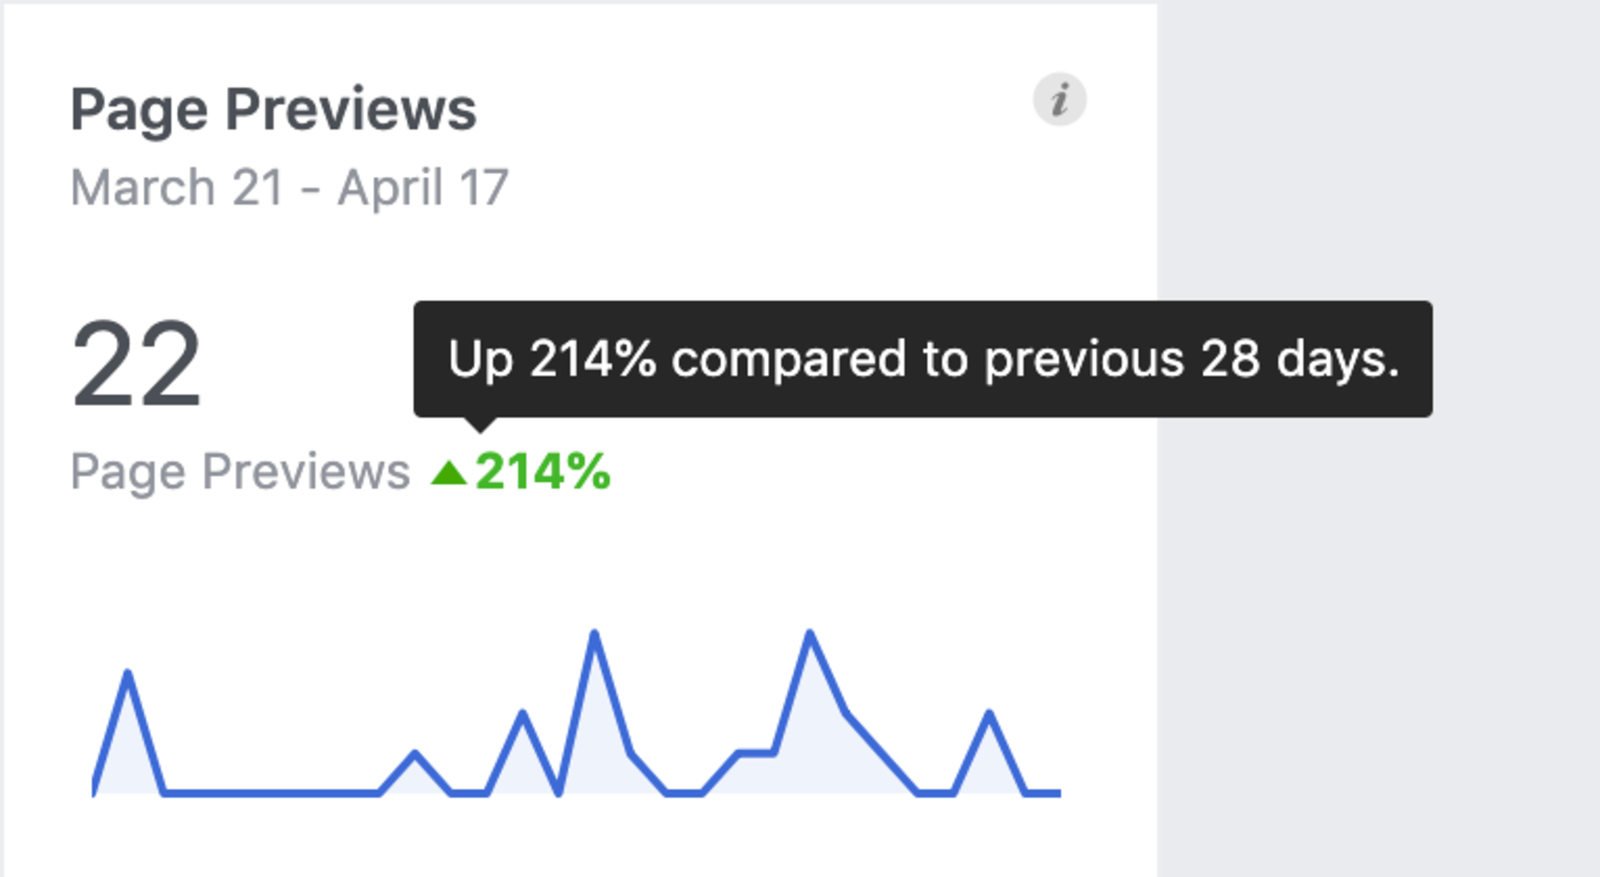
Page Previews
This is an odd metric that I didn’t understand when Facebook first rolled it out. It’s defined as the number of times people hovered over your Page name or profile picture to see a preview of your Page content. So if someone sees your post in their News Feed or in a Group, and they peek at your Page without visiting, you could use this as an Awareness metric.
My 28-day metrics tell me that the number of Page Previews I have is up 214 percent over the previous period. This is nice to know because it means that I’ve been doing something right in my current engagement strategy, but it doesn’t align with any specific business goal of mine either. So it’s nice to know but not something I consider vital.
Page Likes
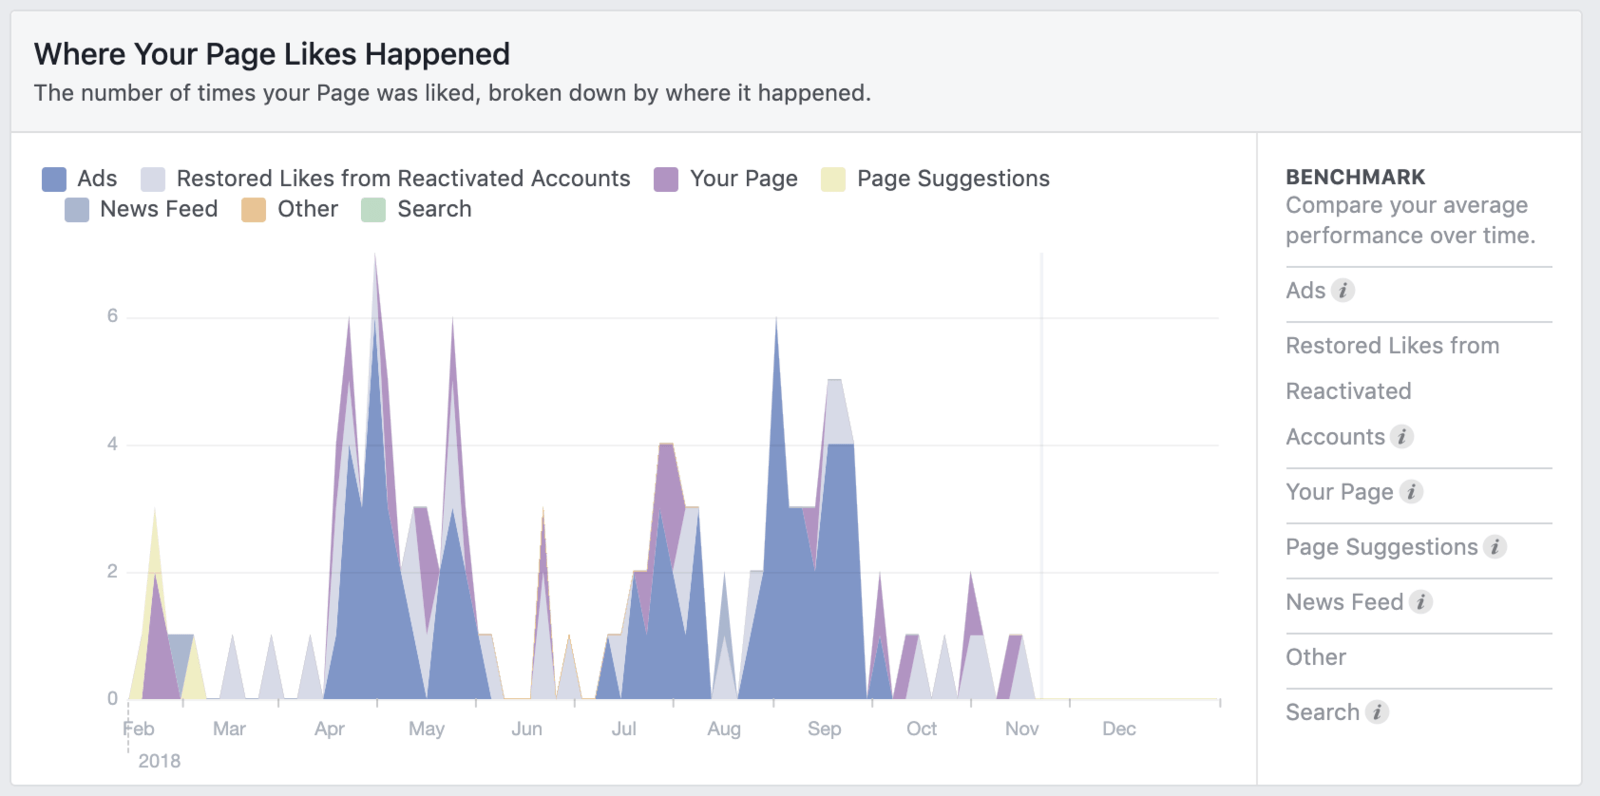
Page Likes is a simple metric; it is just the new people who have clicked “Like” on your Page. This number is a combination of new audience members that you’ve gotten from both paid and organic posts. If you click on the little graph, you will be taken to your Page Likes section where you can see more in-depth data such as a breakout of where new fans are coming from.
If we look back at my 2018 data, we can see that I was getting likes from a mix of sources, especially as a side effect to ads that I was running:
While many marketers will say that Page Likes is a vanity metric, unless someone likes or follows your Page it is difficult to reach them with your message. So my advice is not to worry too much about the number of likes you have. Use this to keep an eye on your Page Likes as a measure of how you’re growing your audience, but also keep in mind that you only want an audience that is truly engaged with your content. It’s better to have 100 fans who really engage than 100,000 that were purchased and don’t interact with your posts.
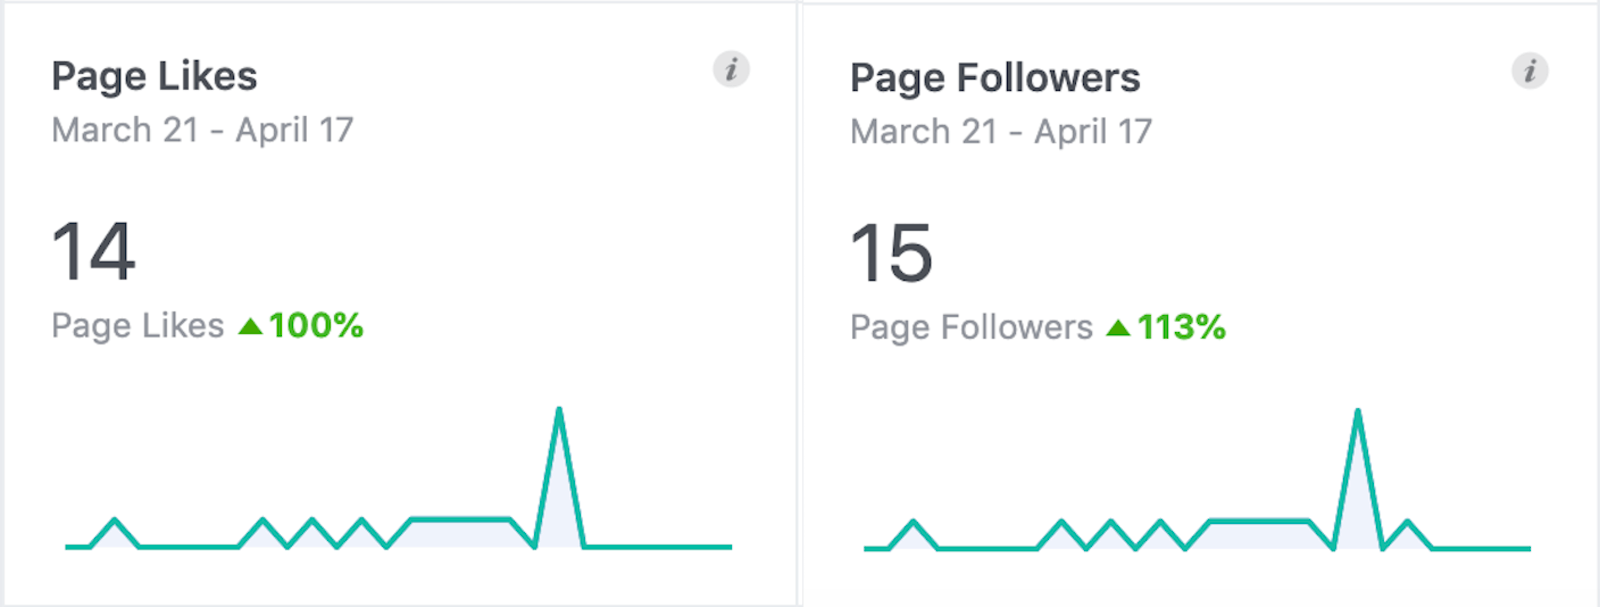
Page Likes Versus Page Followers
We’re going to take a moment here to differentiate between Page Likes versus Page Followers. Facebook introduced Page Followers some time ago. When you like a Page, it serves as an endorsement of the Page and others can see you like it; you also automatically follow that Page. Following a Page means that you will stay informed about new posts made without becoming a fan. Users can also unfollow your Page after liking it.
Overall, on my Page I only have about 40 more followers than likes, so I don’t tend to differentiate much between the metrics. In the past 28 days, I see that I gained one follower more than Page fan. If you find that you have a vast difference in quantity between follows and likes, you may want to track those metrics separately. Otherwise, you may just want to track Page Likes as an indicator of Page growth.
Post Reach
This is one of the metrics that I tend to pay the most attention to when I am gauging the success of my marketing efforts on Facebook. Because the fight for Pages to be seen in the Newsfeed continues to be an uphill battle, I am constantly striving to share content that is relevant and engaging to my audience. When the Facebook algorithm sees that a post is doing especially well with my audience, it will potentially reward the post with more exposure in the Newsfeed.
In the past 28 days, my Post Reach is up by 53 percent. If I know that my posting schedule has been rather consistent month over month, this gives me some good information to realize that whatever strategic shifts I have made in the past 28 days have been successful.

Granted, when I look at my numbers I also realize that I am reaching about 21 percent of my audience. At first glance this may feel dismal, but when compared to the numbers quoted in Data Portal’s Digital 2019: Global Digital Overview, they cite six percent as the global average reach for organic posts. In the footnote, they also caution that Pages with higher numbers of followers could potentially see even less reach.
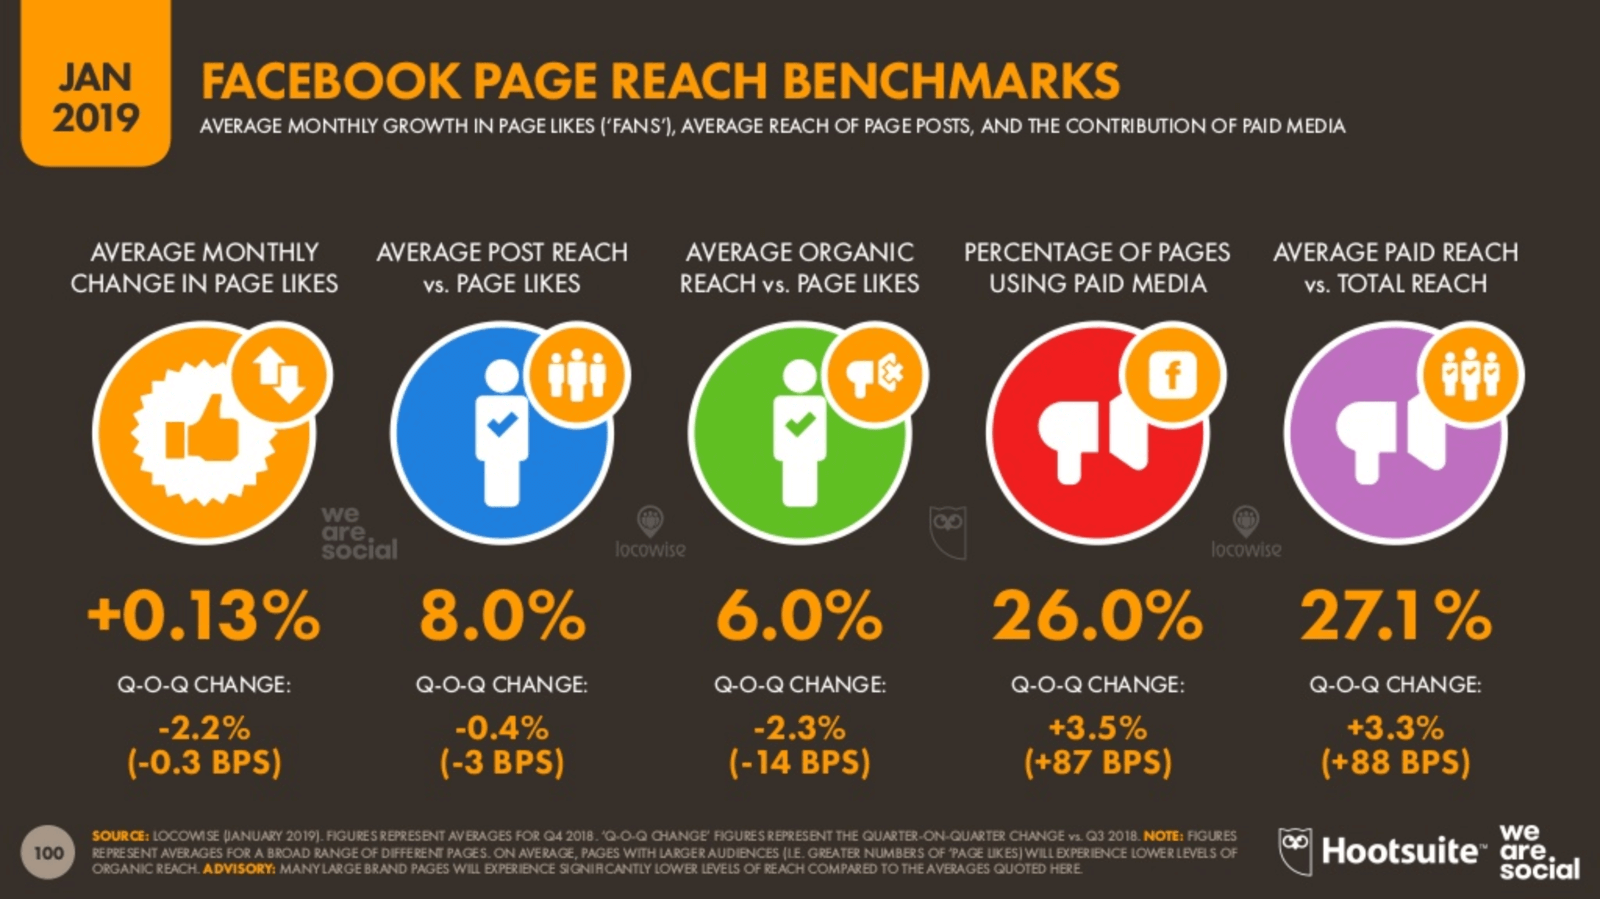
So if you have decided to start benchmarking your Post Reach, you can use the six percent mark as your global average. Keep in mind if you have a large following, your numbers might be slightly lower. But these numbers help us keep our reach in context and understand that our posts may never reach our entire audience. My 21 percent for the period tells me to keep investing in what is working, and to dig further into which posts have been the drivers of success and which have fallen flat.
If I dig into my Post Reach metrics more deeply, I can see a few extra data points. One is the number of people who were reached per day. April 8th was a high point for my reach in the month I am looking back on, so if I quickly reference my content calendar, I can see which post correlates to that spike in reach.
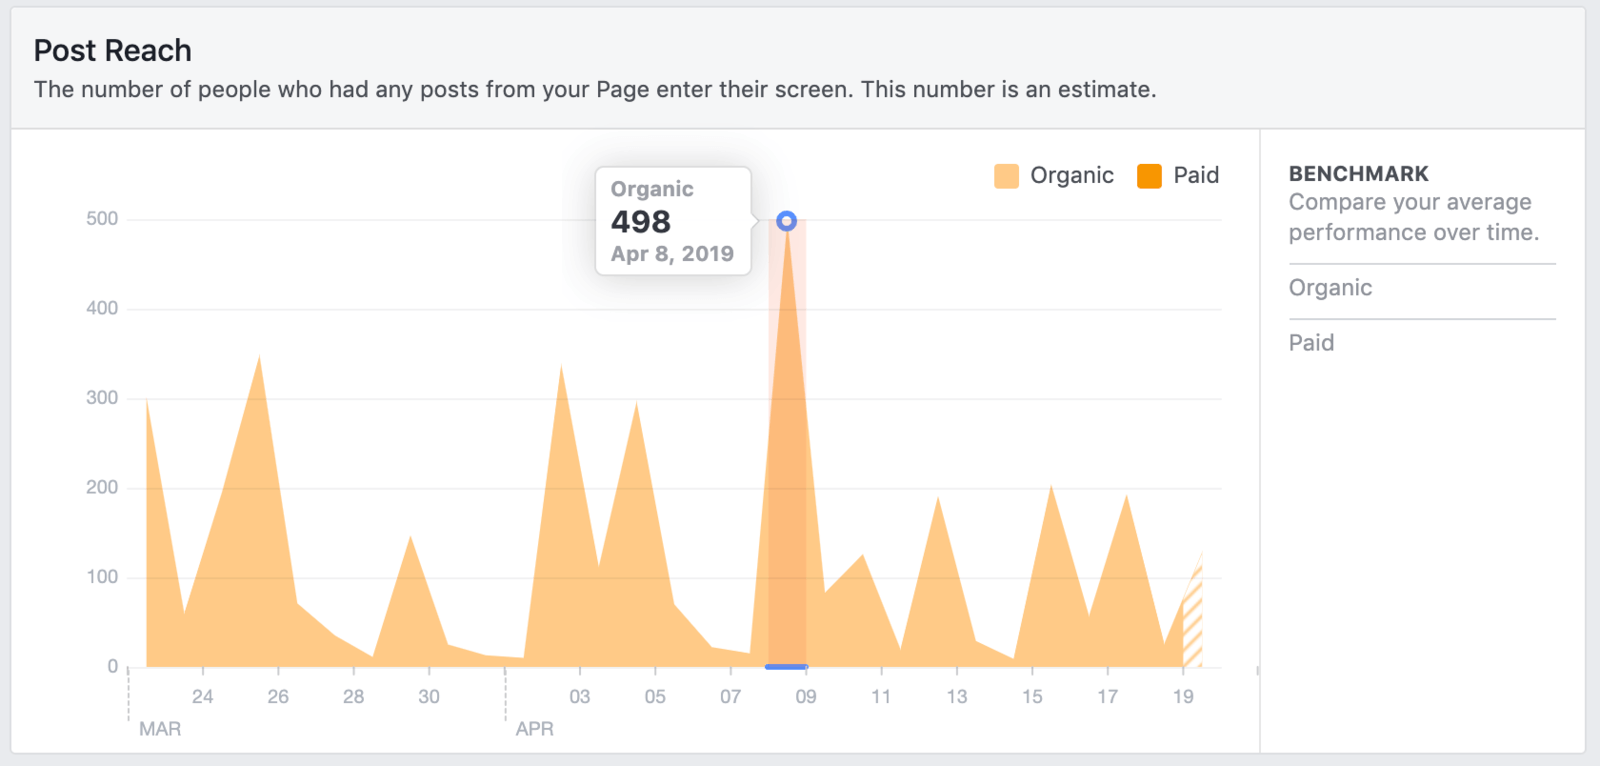
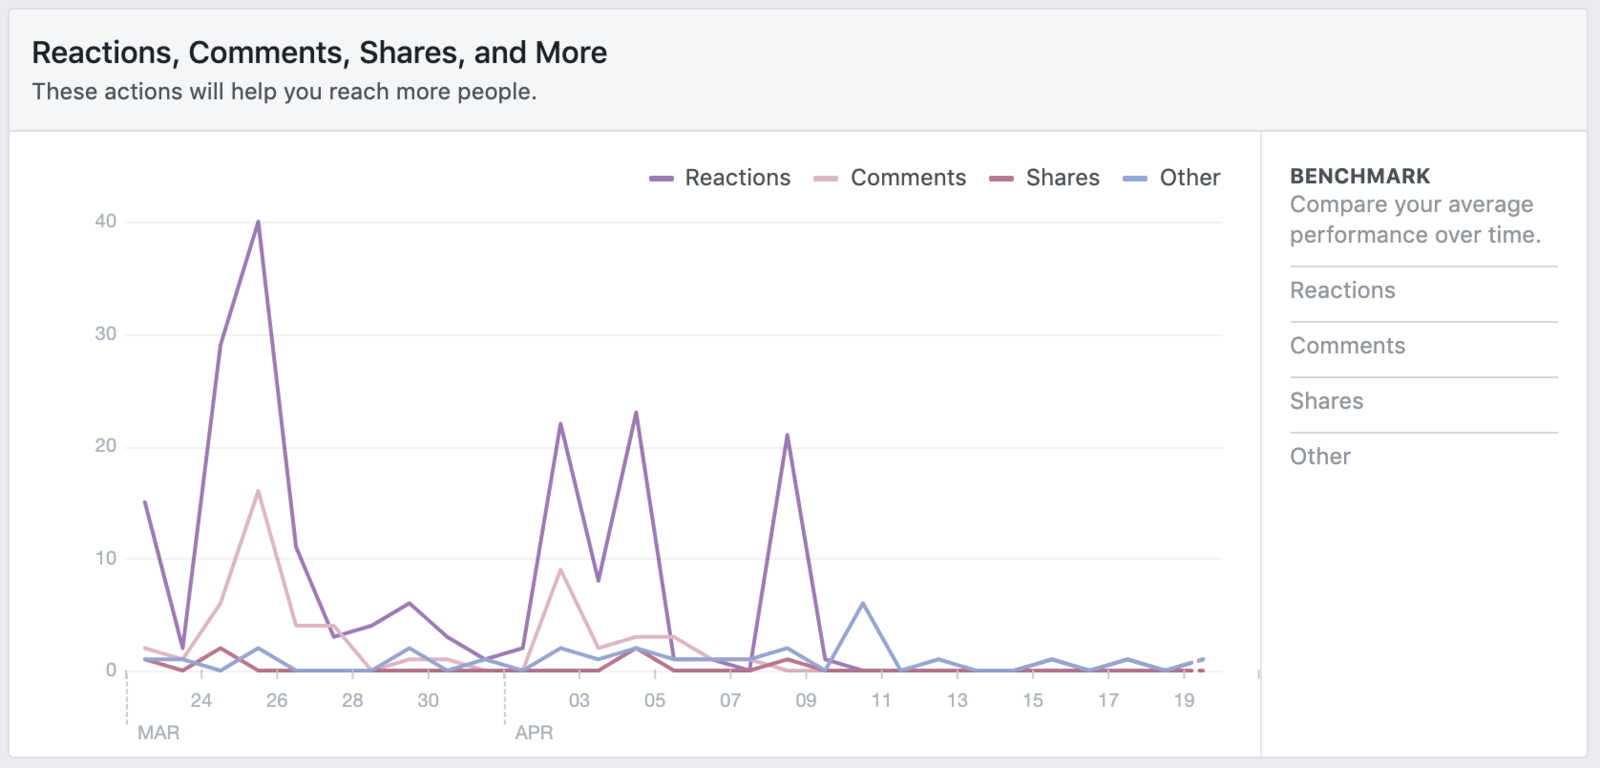
When I scroll down, I can see a little bit more about the engagement my posts have had. Despite having great reach on April 9th, I only got about 20 reactions. Let’s compare this to my March 25th post. It only had a reach of about 350, but had closer to 40 reactions. After April 8th both my reach and my reactions dropped off. This tells me I might need to assess what I was doing differently for my engagement to drop.
Post Engagements
Now let’s dig into Post Engagements because this will give us a more complete picture of how our content is performing. At first glance when I see my 28-day metrics, my Post Engagements look healthy because month over month they are up 125 percent. But when I look at the past week, I see that my engagements dropped by 56 percent:
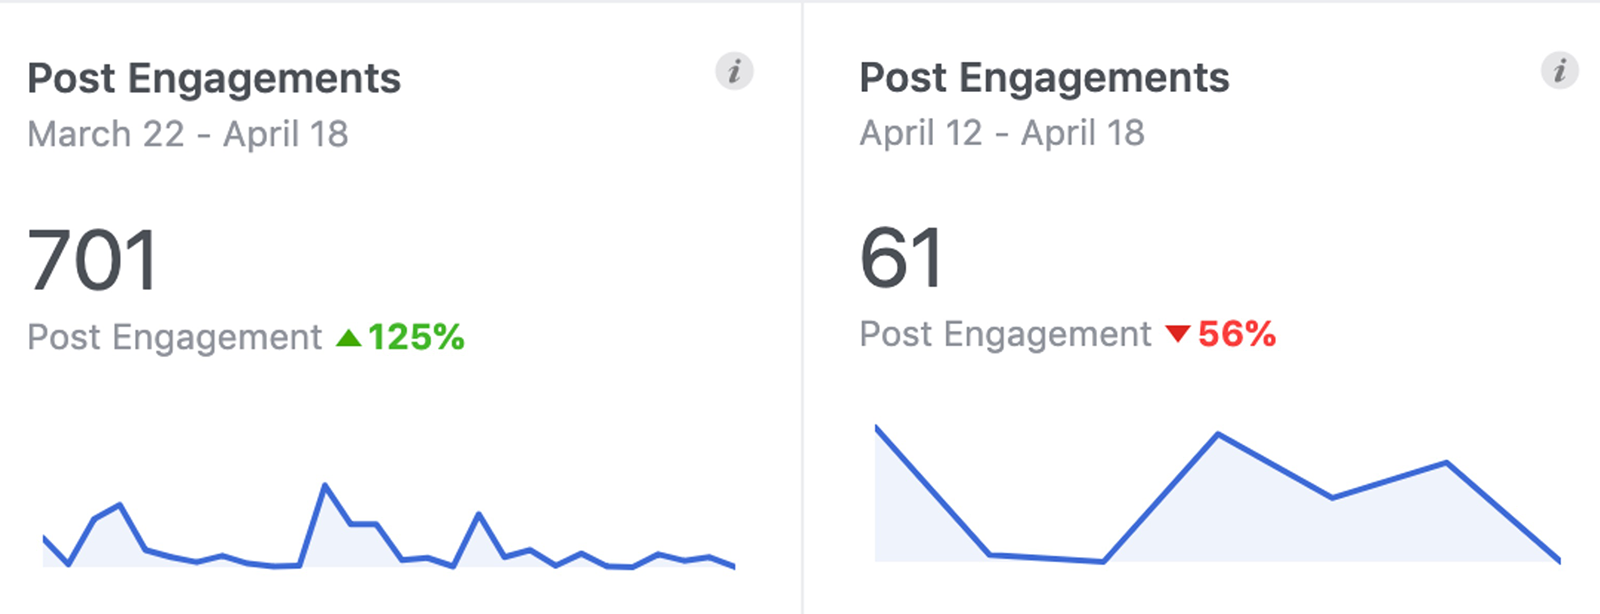
While this might mean I need to adjust my strategy, I also need to take seasonality into account. With Easter and Passover, as well as many schools being on break, this could mean that engagement on Facebook drops for many kinds of businesses. So if you see a drop in your engagement, don’t immediately panic!
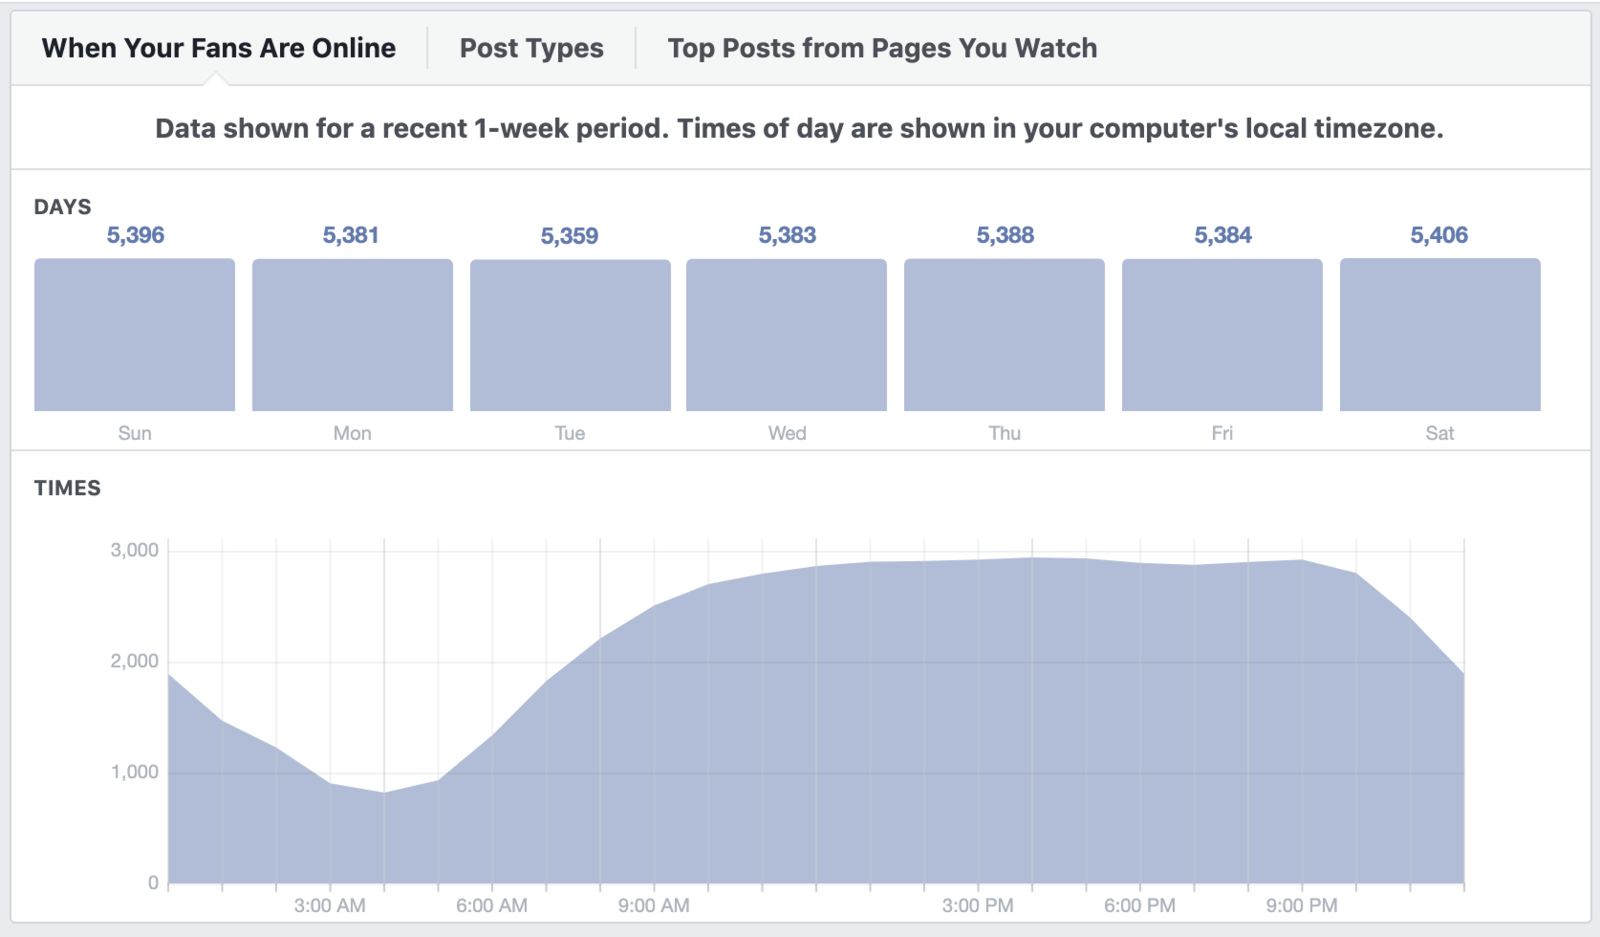
When you click into your Post Engagements graph, it will take you deeper into your post performance data. At the top of the page, you’ll see data on when your fans are online. According to Facebook, my fanbase is pretty consistent throughout the week, with no major dips on weekends. The Times graph shows me that my fans are online consistently from noon until 9pm with a few small spikes throughout the day. Because I don’t post late or early in the morning, I know that my dip in engagement isn’t likely due to posting at the wrong time.
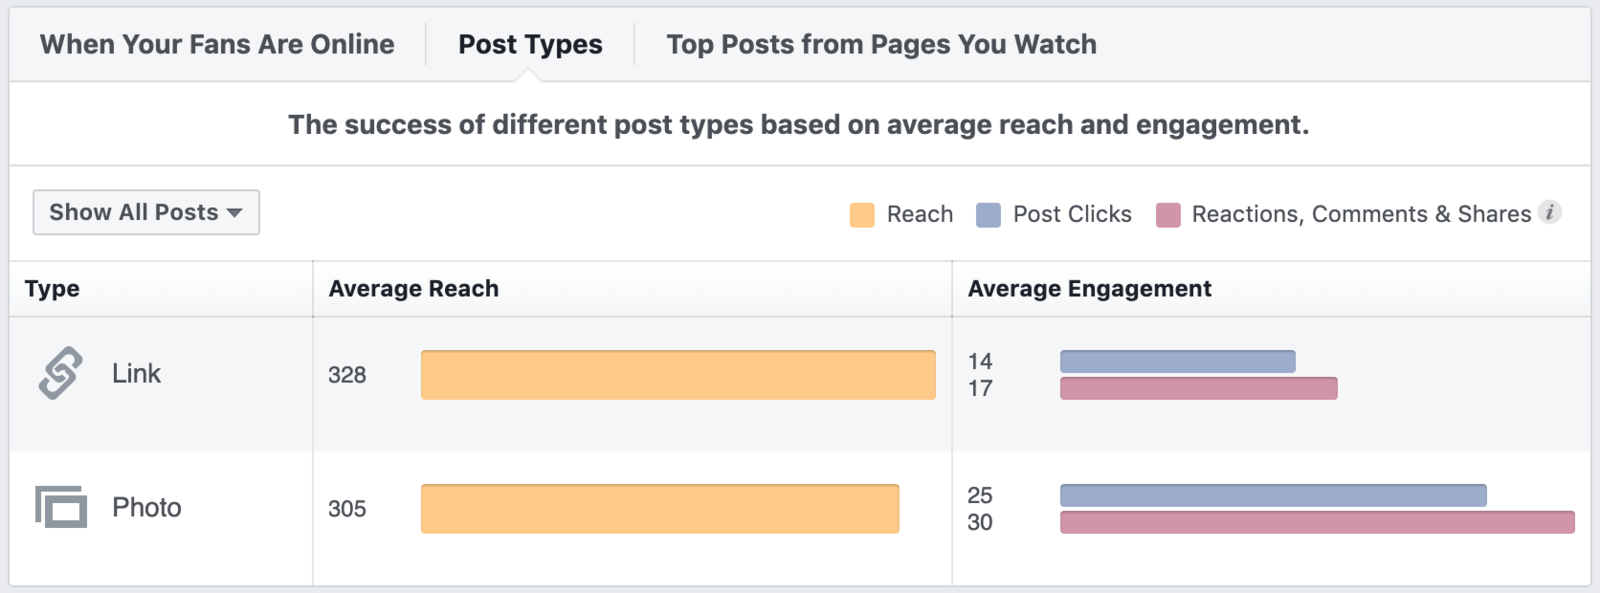
Facebook also lets you take a look at how different Post Types are performing. Although it does not specify the time period, my assumption is that like the data showing when your fans are online, the Post Types data is also for the recent one-week period. An odd finding is that while my links have had a slightly higher reach, I have had better engagement with photos.
One thing to note is that there are no videos in my last week of posting. So I decided to scroll down and take a look at the past year of posts to see if I was missing out by not including video. For the sake of this article, I decided to compare the time of writing to a similar time period last year to see if seasonality was playing a role in my declining reach or if I needed to make some strategic shifts.
2019 Data
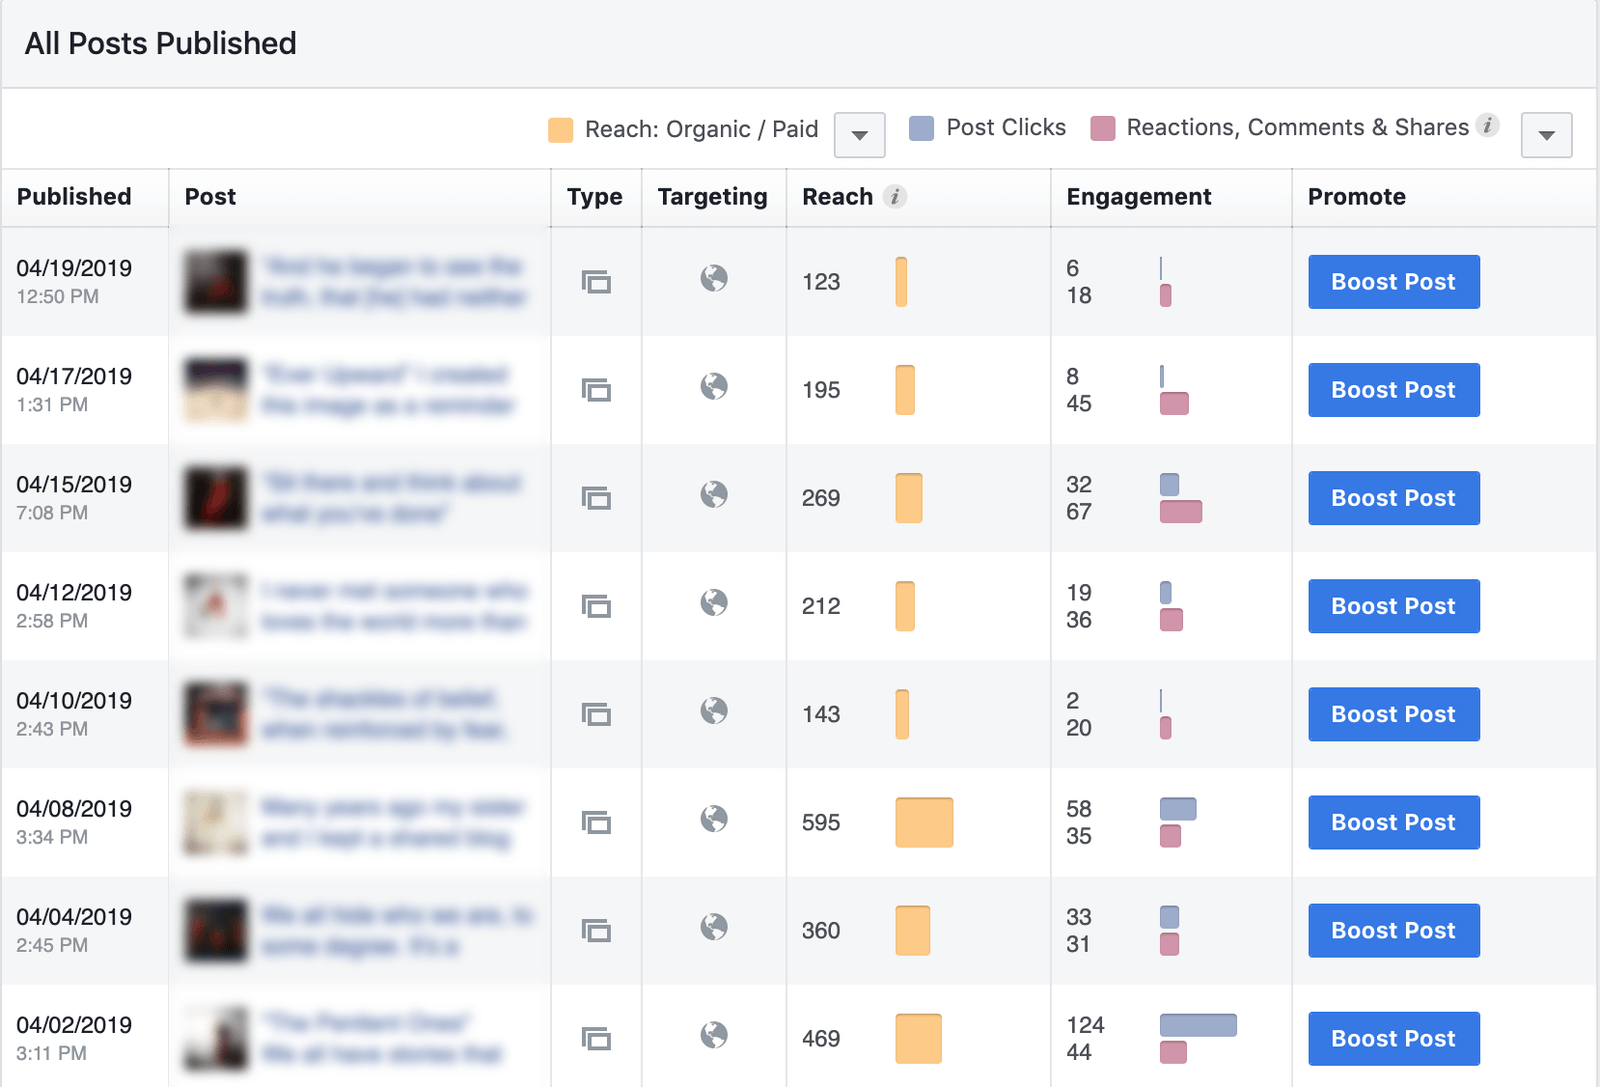
So far this year, I have been posting a lot more consistently than I was in 2018. When I compare my Reach with the number of Post Clicks and Engagements, I can see that despite my 4/17 post getting a solid number of reactions, the post only generated eight clicks. While we will never know the ins and outs of the algorithm, one could guess that the lack of clicks could have limited my Reach. Conversely, my 4/02 post had 124 clicks with a similar number of reactions. But it had more than double the reach!
Because we know that I am posting when my audience is online, and all of these posts are images, then we can deduce that the lack of reach has to do either with an image that isn’t captivating enough to stop someone’s scroll in the News Feed or my caption didn’t engage the viewer.
Because I cross-post a lot of my content on Instagram, I thought it would be interesting to check my Instagram analytics (which we will be covering next) to see if I would see the same performance on both platforms. Oddly, I saw exactly the opposite situation on Instagram. My 4/17 post had double the reach of my 4/02 post.
Something interesting to consider is that my 4/17 post was more about the image with a simple caption to accompany it. However, on 4/02, I was telling an in-depth and important story along with my image. It may be that my Facebook audience responds more to personal stories, whereas my Instagram audience engages more with pretty pictures. These are now data points that I can test in my future strategy!
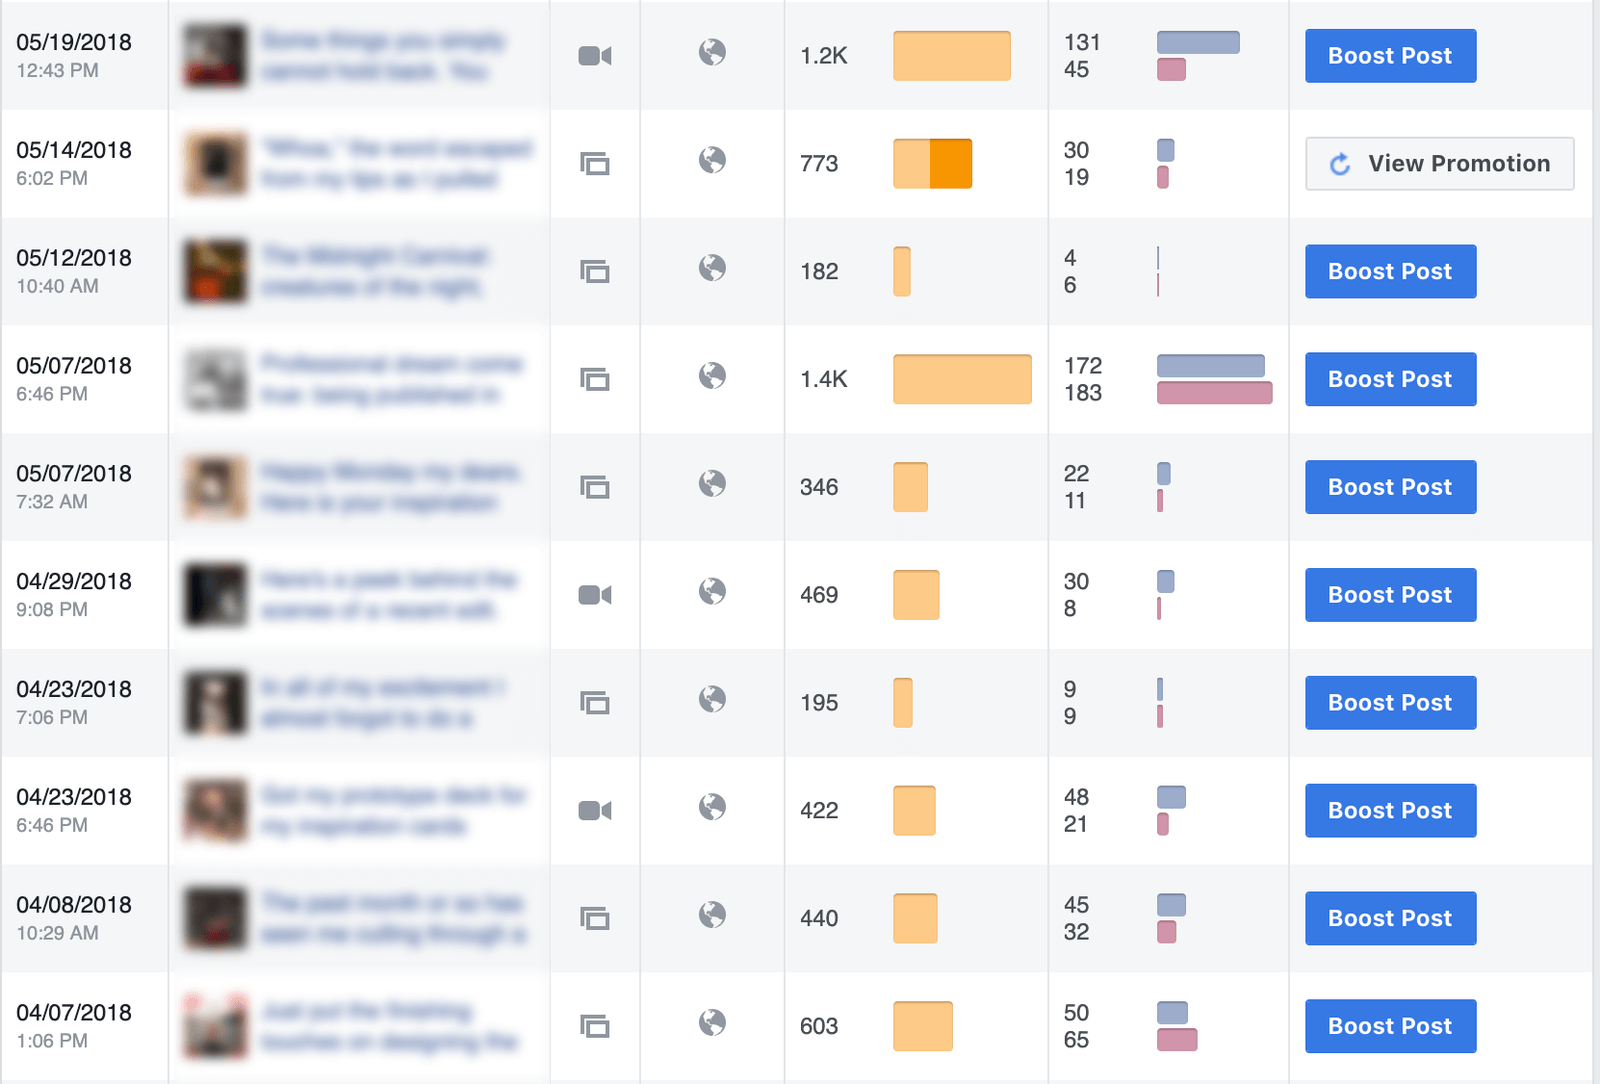
2018 Data
Around this time last year, I was experimenting more with video but posting with less consistency. We can see that all of my video efforts in April did little to improve my reach, with all of my posts averaging a reach of about 400. I decided to include May because I had two posts with significant reach and tested a boosted post.
Normally I don’t recommend boosting posts (and we will talk about Facebook Ads in an upcoming article), but I was trying to generate awareness for a product release. If you’re not looking for web traffic or sales, a boosted post is fine. In my case, this particular boosted post helped to increase my reach but did little to help with my engagement.
Two things I posted did ignite the algorithm and increase my reach. One was a behind-the-scenes video of a project that I was working on, and the other was a post about a professional win. This data tells me that my audience really likes behind-the-scenes peeks into my business, process and product creation. Occasionally, they also enjoy celebrating alongside of me.
So, if you have been posting on Facebook regularly, take a look at how your past posts have been performing. Can you make connections between what is performing well and why? If so, consciously test some of these tactics to see if you can fill your content calendar with similar content. For example, after reviewing my data, I have decided that I am going to test behind-the-scenes images and videos on a weekly or bi-monthly basis to see if I can achieve better reach.
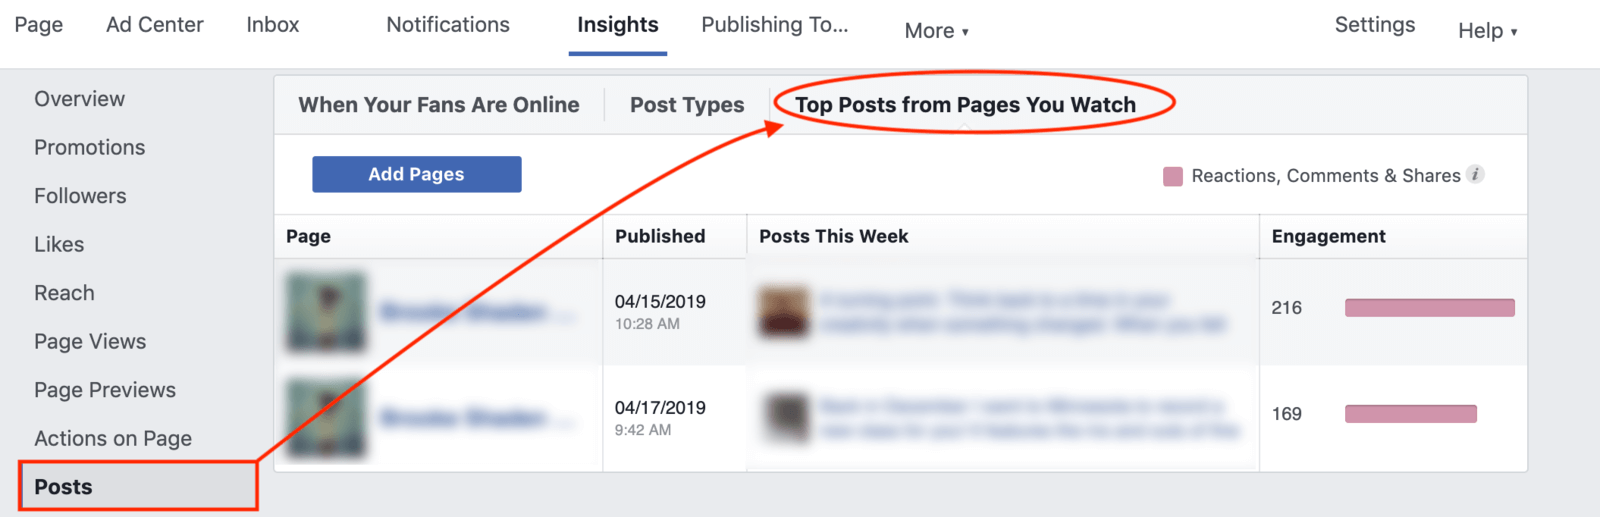
Competitor Performance
If you explore the Posts section, you can see that Facebook also gives you Top Posts from Pages You Watch. Because only one Page I watch posted in the past week, I have limited data to explore, but if I start watching Pages that have more activity, I could get a good idea of what is working among my competitors and industry leaders:
Demographic Details of Your Fans
One thing that Facebook does not make easily accessible in your Overview is the demographic information on the people who like your Page. To access that, you’ll need to navigate down to the People section on the left-hand side of your Insights page.
Here you will be able to dig into information on your fans, followers, the people your posts are reaching and the people engaging with your posts. Keep in mind that if you have under 1,000 fans, you might not have access to this information as it would be a privacy concern.
While the demographic information on your fans is important, my recommendation is to keep a close watch on the data around People Reached versus People Engaged. While Facebook has been delivering my content to more women in the 25-34 age range, the data tells me that women in the 35-44 age range are more engaged.
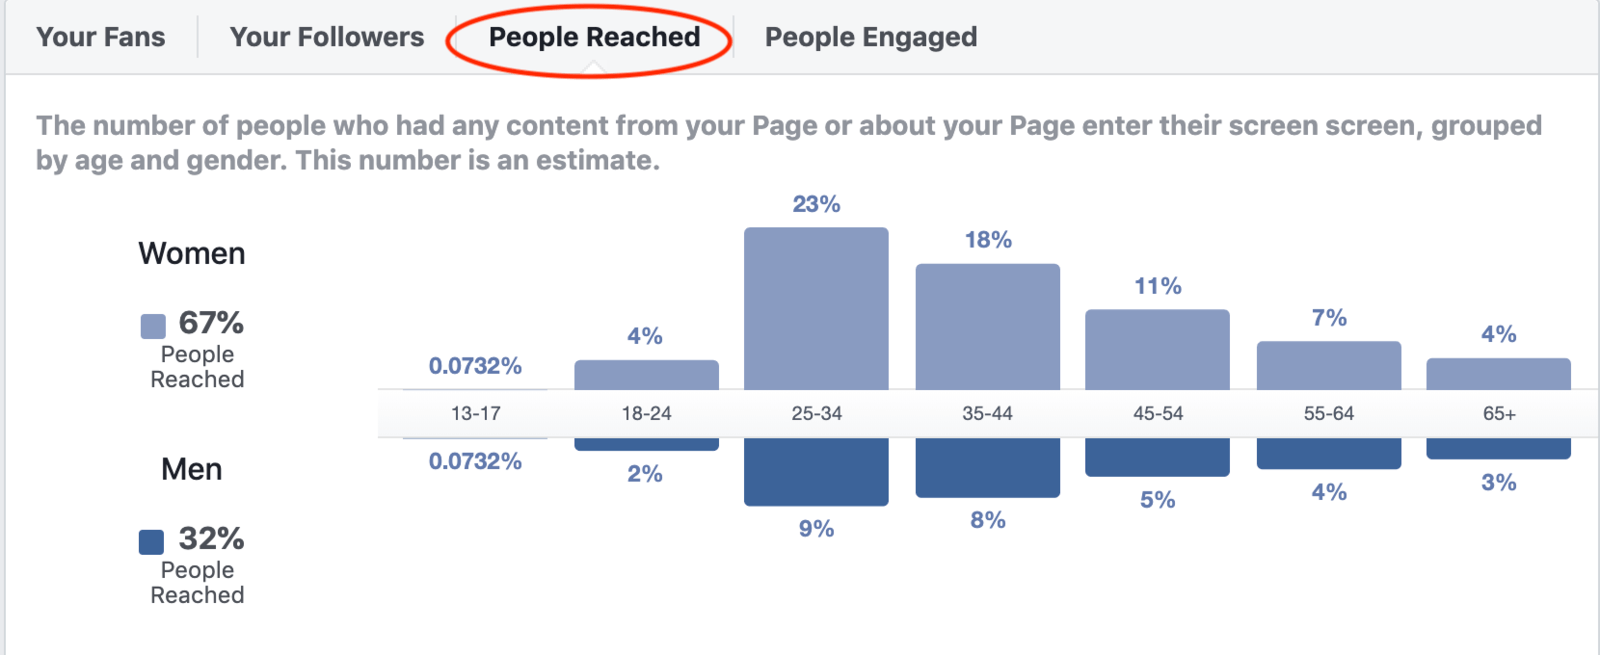
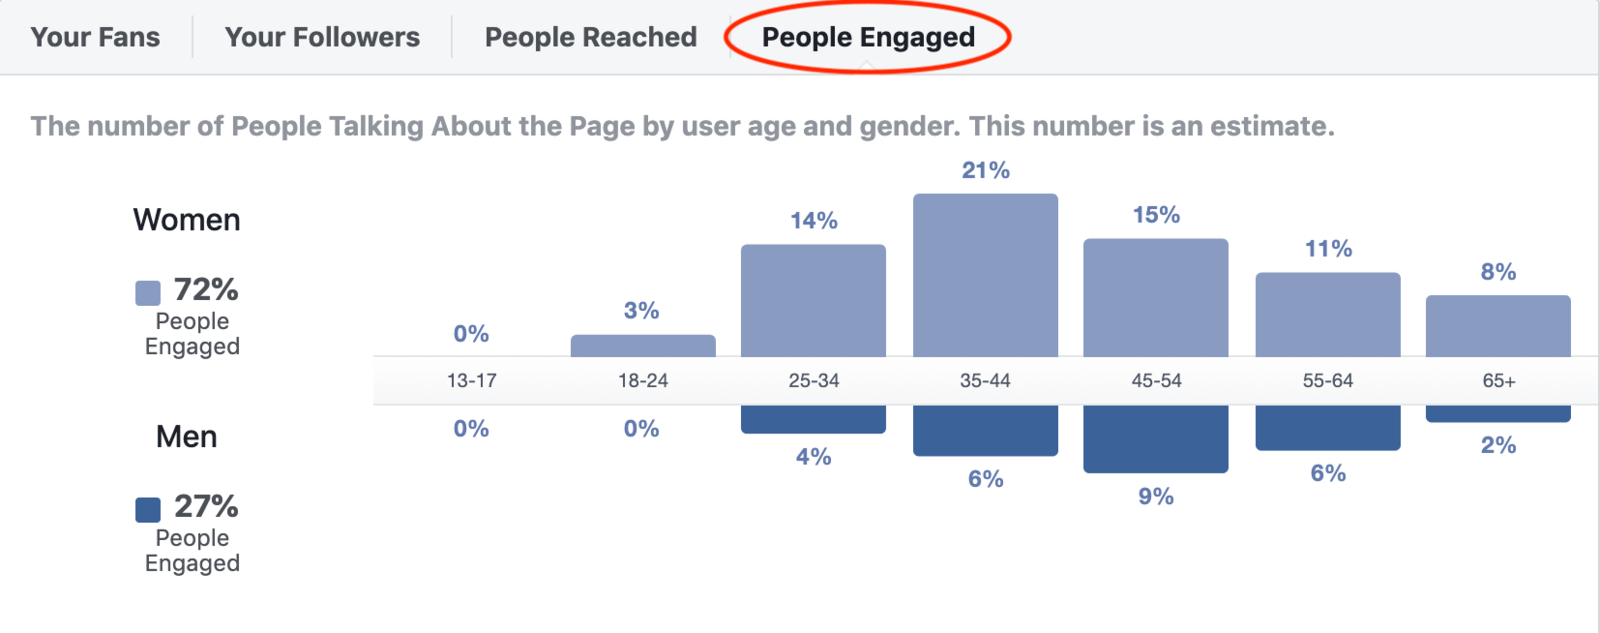
I can also see that while I don’t reach many men in general, the ones in the 45-54 age group engage the most.
Further down on the People page, you can see the countries and cities that your fans hail from, as well as the language they speak. If your business relies on local customers, you will want to pay close attention to the cities your fans come from to make sure you’re reaching relevant people.
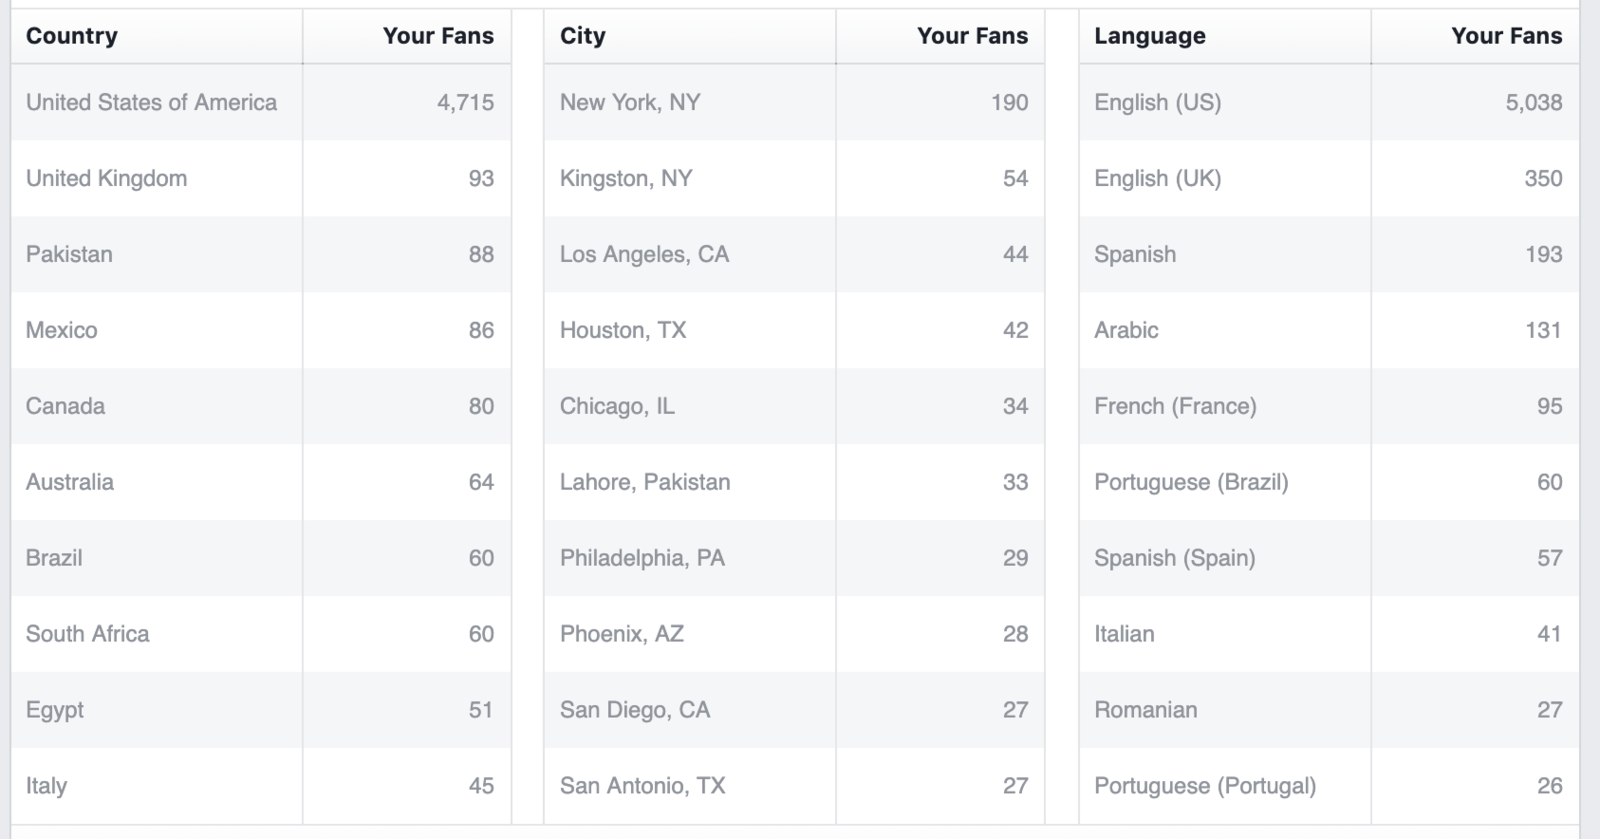
Overall, this is important data to consider when thinking about your ideal client avatar as well as the content that you create in your social media strategy. If you find that your demographic data is not in line with your ideal client avatar, it might be time to rethink what you have been posting on Facebook and the kinds of fans that you have been attracting.
Applying Insights to Your Facebook Strategy
Now that you know where to find the most important organic metrics for your Facebook Page, you can begin to track your performance and see what is working for you, what has worked in the past and what is working for your competitors. Not only will you be able to see what post types work best for your Page, but you will be able to see exactly how many people were reached and how many engaged.
By comparing this data to your content calendar and your overall social media strategy and ideal client avatar, you will be able to track and chart the success of your Facebook marketing efforts. Keep a test and learn mentality. If something really engages your fanbase, ask yourself why. The same goes for when a post falls flat. By keeping an open mind to testing, and tracking your data over time, you will be able to curate a calendar of content that continues to teach you about the wants and needs of your audience.
Remember, you may not be able to reach all of your fans. Data shows that on average, Pages are reaching about six percent of their fans. But by studying your Insights closely and creating engaging content, you can reach a much higher percentage of your fans and make Facebook marketing work for your photography business!